Reebok 2014 Annual Report Download - page 115
Download and view the complete annual report
Please find page 115 of the 2014 Reebok annual report below. You can navigate through the pages in the report by either clicking on the pages listed below, or by using the keyword search tool below to find specific information within the annual report.-
 1
1 -
2
-
3
-
4
-
5
-
6
-
7
-
8
-
9
-
10
-
11
-
12
-
13
-
14
-
15
-
16
-
17
-
18
-
19
-
20
-
21
-
22
-
23
-
24
-
25
-
26
-
27
-
28
-
29
-
30
-
31
-
32
-
33
-
34
-
35
-
36
-
37
-
38
-
39
-
40
-
41
-
42
-
43
-
44
-
45
-
46
-
47
-
48
-
49
-
50
-
51
-
52
-
53
-
54
-
55
-
56
-
57
-
58
-
59
-
60
-
61
-
62
-
63
-
64
-
65
-
66
-
67
-
68
-
69
-
70
-
71
-
72
-
73
-
74
-
75
-
76
-
77
-
78
-
79
-
80
-
81
-
82
-
83
-
84
-
85
-
86
-
87
-
88
-
89
-
90
-
91
-
92
-
93
-
94
-
95
-
96
-
97
-
98
-
99
-
100
-
101
-
102
-
103
-
104
-
 105
105 -
 106
106 -
 107
107 -
 108
108 -
 109
109 -
 110
110 -
 111
111 -
 112
112 -
 113
113 -
 114
114 -
 115
115 -
 116
116 -
 117
117 -
 118
118 -
 119
119 -
 120
120 -
 121
121 -
 122
122 -
 123
123 -
 124
124 -
 125
125 -
126
-
127
-
128
-
129
-
130
-
131
-
132
-
133
-
134
-
135
-
136
-
137
-
138
-
139
-
140
-
141
-
142
-
143
-
144
-
145
-
146
-
147
-
148
-
149
-
150
-
151
-
152
-
153
-
154
-
155
-
156
-
157
-
158
-
159
-
160
-
161
-
162
-
163
-
164
-
165
-
166
-
167
-
168
-
169
-
170
-
171
-
172
-
173
-
174
-
175
-
176
-
177
-
178
-
179
-
180
-
181
-
182
-
183
-
184
-
185
-
186
-
187
-
188
-
189
-
190
-
191
-
192
-
193
-
194
-
195
-
196
-
197
-
198
-
199
-
200
-
201
-
202
-
203
-
204
-
205
-
206
-
207
-
208
-
209
-
210
-
211
-
212
-
213
-
214
-
215
-
216
-
217
-
218
-
219
-
220
-
221
-
222
-
223
-
224
-
225
-
226
-
227
-
228
-
229
-
230
-
231
-
232
-
233
-
234
-
235
-
236
-
237
-
238
-
239
-
240
-
241
-
242
-
243
-
244
-
245
-
246
-
247
-
248
-
249
-
250
-
251
-
252
-
253
-
254
-
255
-
256
-
257
-
258
-
259
-
260
-
261
-
262
-
263
-
264
-
265
-
266
-
267
-
268
 |
 |
Group Management Report – Financial Review
111
2014
/
03.2
/
adidas Group
/
2014 Annual Report
Group Business Performance
/
Income Statement
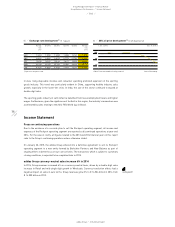
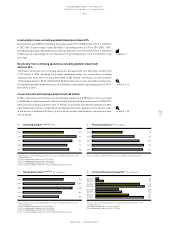
Operating overhead expenses as a percentage of sales decrease
0.3 percentage points
Group operating overheads include overhead costs related to marketing, logistics, sales and R&D
as well as central administration. Almost half of the operating overhead expenses are related to
personnel costs. In absolute terms, operating overhead expenses grew 1% to € 4.280 billion in 2014
versus € 4.226 billion in 2013. This was primarily a result of the expansion of the Group’s own-retail
activities, more than offsetting a decrease in central administration costs. As a percentage of sales,
operating overhead expenses declined 0.3 percentage points to 29.4% (2013: 29.8%).
Number of Group employees up 8%
At the end of December 2014, the Group employed 53,731 people. This represents an increase of 8%
versus the prior year level of 49,808. New hirings related to the expansion of the Group’s own-retail
store base were the main driver of this development. On a full-time equivalent basis, the number of
employees increased 7% to 45,917 at the end of 2014 (2013: 42,758).
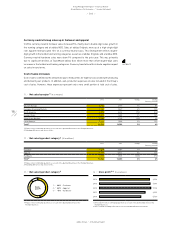
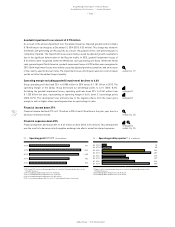
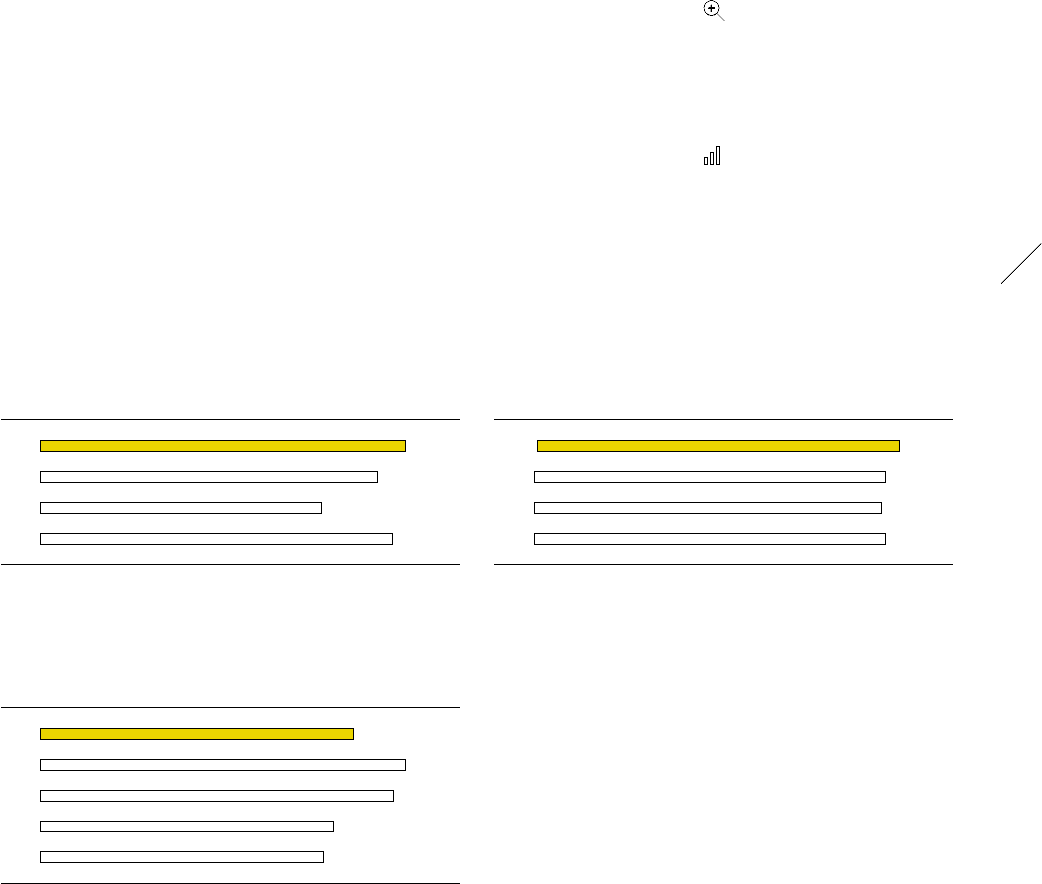
EBITDA decreases 14%
The Group’s earnings before interest, taxes, depreciation and amortisation as well as impairment
losses/reversal of impairment losses on property, plant and equipment and intangible assets
(EBITDA) decreased 14% to € 1.283 billion in 2014 (2013: € 1.496 billion). Depreciation and
amortisation expense for tangible and intangible assets (excluding impairment losses/reversal of
impairment losses) increased 10% to € 309 million in 2014 (2013: € 281 million). This development
is mainly due to an increase in property, plant and equipment. In accordance with IFRS, intangible
assets with indefinite useful lives (goodwill and trademarks) are tested annually and additionally
when there are indications of potential impairment. In this connection, impairment of intangible
assets with unlimited useful lives was incurred in 2014.
see Employees, p. 82
see Diagram 22
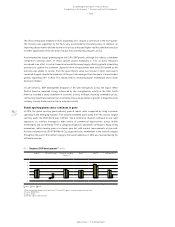
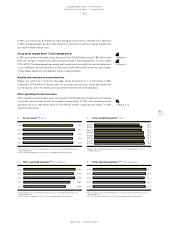
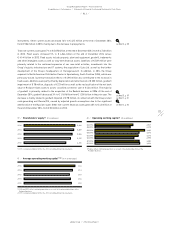
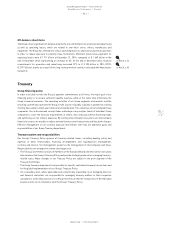
20
/
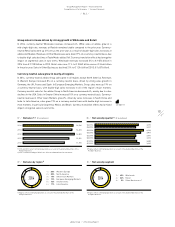
Sales working budget 1) 2) (in % of net sales)
2014 2.6
2013 2.4
2012 2.0
2011 2.5
1) 2014 and 2013 reflect continuing operations as a result of the planned divestiture of the
Rockport business.
2) 2011 restated according to IAS 8 in the 2012 consolidated financial statements.
21
/
Marketing working budget 1) 2) (in % of net sales)
2014 10.6
2013 10.2
2012 10.1
2011 10.2
1) 2014 and 2013 reflect continuing operations as a result of the planned divestiture of the
Rockport business.
2) 2011 restated according to IAS 8 in the 2012 consolidated financial statements.
22
/
EBITDA 1) 2) (€ in millions)
2014 1,283
2013 1,496
2012 1,445
2011 1,199
2010 1,159
1) 2014 and 2013 reflect continuing operations as a result of the planned divestiture of the
Rockport business.
2) 2011 restated according to IAS 8 in the 2012 consolidated financial statements.