Reebok 2014 Annual Report Download - page 112
Download and view the complete annual report
Please find page 112 of the 2014 Reebok annual report below. You can navigate through the pages in the report by either clicking on the pages listed below, or by using the keyword search tool below to find specific information within the annual report.-
 1
1 -
2
-
3
-
4
-
5
-
6
-
7
-
8
-
9
-
10
-
11
-
12
-
13
-
14
-
15
-
16
-
17
-
18
-
19
-
20
-
21
-
22
-
23
-
24
-
25
-
26
-
27
-
28
-
29
-
30
-
31
-
32
-
33
-
34
-
35
-
36
-
37
-
38
-
39
-
40
-
41
-
42
-
43
-
44
-
45
-
46
-
47
-
48
-
49
-
50
-
51
-
52
-
53
-
54
-
55
-
56
-
57
-
58
-
59
-
60
-
61
-
62
-
63
-
64
-
65
-
66
-
67
-
68
-
69
-
70
-
71
-
72
-
73
-
74
-
75
-
76
-
77
-
78
-
79
-
80
-
81
-
82
-
83
-
84
-
85
-
86
-
87
-
88
-
89
-
90
-
91
-
92
-
93
-
94
-
95
-
96
-
97
-
98
-
99
-
100
-
101
-
 102
102 -
 103
103 -
 104
104 -
 105
105 -
 106
106 -
 107
107 -
 108
108 -
 109
109 -
 110
110 -
 111
111 -
 112
112 -
 113
113 -
 114
114 -
 115
115 -
 116
116 -
 117
117 -
 118
118 -
 119
119 -
 120
120 -
 121
121 -
 122
122 -
123
-
124
-
125
-
126
-
127
-
128
-
129
-
130
-
131
-
132
-
133
-
134
-
135
-
136
-
137
-
138
-
139
-
140
-
141
-
142
-
143
-
144
-
145
-
146
-
147
-
148
-
149
-
150
-
151
-
152
-
153
-
154
-
155
-
156
-
157
-
158
-
159
-
160
-
161
-
162
-
163
-
164
-
165
-
166
-
167
-
168
-
169
-
170
-
171
-
172
-
173
-
174
-
175
-
176
-
177
-
178
-
179
-
180
-
181
-
182
-
183
-
184
-
185
-
186
-
187
-
188
-
189
-
190
-
191
-
192
-
193
-
194
-
195
-
196
-
197
-
198
-
199
-
200
-
201
-
202
-
203
-
204
-
205
-
206
-
207
-
208
-
209
-
210
-
211
-
212
-
213
-
214
-
215
-
216
-
217
-
218
-
219
-
220
-
221
-
222
-
223
-
224
-
225
-
226
-
227
-
228
-
229
-
230
-
231
-
232
-
233
-
234
-
235
-
236
-
237
-
238
-
239
-
240
-
241
-
242
-
243
-
244
-
245
-
246
-
247
-
248
-
249
-
250
-
251
-
252
-
253
-
254
-
255
-
256
-
257
-
258
-
259
-
260
-
261
-
262
-
263
-
264
-
265
-
266
-
267
-
268
 |
 |

108
2014
/
03.2
/
adidas Group
/
2014 Annual Report
Group Management Report – Financial Review
Group Business Performance
/
Income Statement
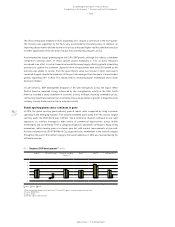
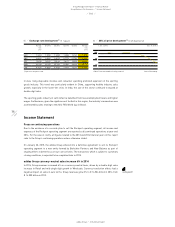
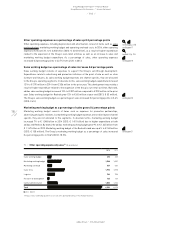
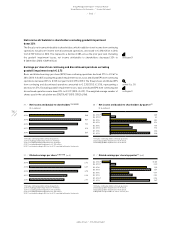
Currency-neutral Group sales up in footwear and apparel
In 2014, currency-neutral footwear sales increased 5%, mainly due to double-digit sales growth in
the running category and at adidas NEO. Sales at adidas Originals were up at a high-single-digit
rate. Apparel revenues grew 12% on a currency-neutral basis. This development reflects double-
digit growth in the football and running categories as well as at adidas Originals and at adidas NEO.
Currency-neutral hardware sales were down 9% compared to the prior year. This was primarily
due to significant declines at TaylorMade-adidas Golf, which more than offset double-digit sales
increases in the football and training categories. Currency translation effects had a negative impact
on sales in euro terms.
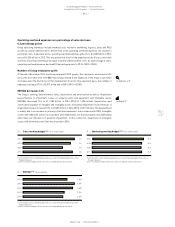
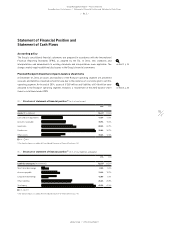
Cost of sales increases
Cost of sales is defined as the amount we pay to third parties for expenses associated with producing
and delivering our products. In addition, own-production expenses are also included in the Group’s
cost of sales. However, these expenses represent only a very small portion of total cost of sales.
see Table 12
11
/
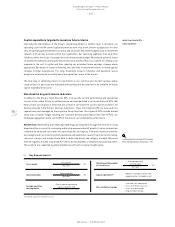
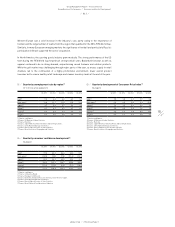
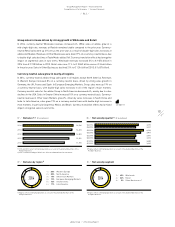
Net sales by region 1) (€ in millions)
2014 2013 Change Change
(currency-neutral)
Western Europe 4,112 3,777 9% 8%
European Emerging Markets 1,932 1,867 4% 19%
North America 2,972 3,203 (7%) (6%)
Greater China 1,811 1,655 9% 10%
Other Asian Markets 2,085 2,135 (2%) 2%
Latin America 1,622 1,568 3% 19%
Total 2) 14,534 14,203 2% 6%
1) Figures reflect continuing operations as a result of the planned divestiture of the Rockport business.
2) Rounding differences may arise in totals.
12
/
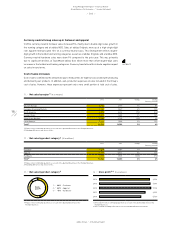
Net sales by product category 1) (€ in millions)
2014 2013 Change Change
(currency-neutral)
Footwear 6,658 6,587 1% 5%
Apparel 6,279 5,811 8% 12%
Hardware 1,597 1,806 (12%) (9%)
Total 2) 14,534 14,203 2% 6%
1) Figures reflect continuing operations as a result of the planned divestiture of the Rockport business.
2) Rounding differences may arise in totals.
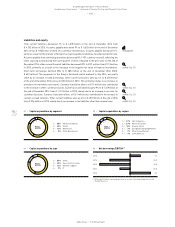
13
/
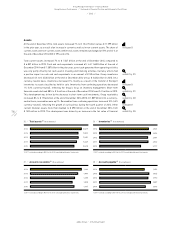
Net sales by product category 1)
1) Figures reflect continuing operations as a result of the planned divestiture of the
Rockport business.
1
/
46% Footwear
2
/
43% Apparel
3
/
11% Hardware
14
/
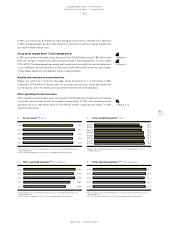
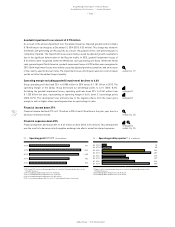
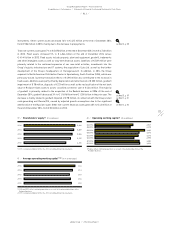
Gross profit 1) 2) (€ in millions)
2014 6,924
2013 7,001
2012 7,103
2011 6,329
2010 5,730
1) 2014 and 2013 reflect continuing operations as a result of the planned divestiture of the
Rockport business.
2) 2011 restated according to IAS 8 in the 2012 consolidated financial statements.
2014 1
2
3