Reebok 2014 Annual Report Download - page 111
Download and view the complete annual report
Please find page 111 of the 2014 Reebok annual report below. You can navigate through the pages in the report by either clicking on the pages listed below, or by using the keyword search tool below to find specific information within the annual report.-
 1
1 -
2
-
3
-
4
-
5
-
6
-
7
-
8
-
9
-
10
-
11
-
12
-
13
-
14
-
15
-
16
-
17
-
18
-
19
-
20
-
21
-
22
-
23
-
24
-
25
-
26
-
27
-
28
-
29
-
30
-
31
-
32
-
33
-
34
-
35
-
36
-
37
-
38
-
39
-
40
-
41
-
42
-
43
-
44
-
45
-
46
-
47
-
48
-
49
-
50
-
51
-
52
-
53
-
54
-
55
-
56
-
57
-
58
-
59
-
60
-
61
-
62
-
63
-
64
-
65
-
66
-
67
-
68
-
69
-
70
-
71
-
72
-
73
-
74
-
75
-
76
-
77
-
78
-
79
-
80
-
81
-
82
-
83
-
84
-
85
-
86
-
87
-
88
-
89
-
90
-
91
-
92
-
93
-
94
-
95
-
96
-
97
-
98
-
99
-
100
-
 101
101 -
 102
102 -
 103
103 -
 104
104 -
 105
105 -
 106
106 -
 107
107 -
 108
108 -
 109
109 -
 110
110 -
 111
111 -
 112
112 -
 113
113 -
 114
114 -
 115
115 -
 116
116 -
 117
117 -
 118
118 -
 119
119 -
 120
120 -
 121
121 -
122
-
123
-
124
-
125
-
126
-
127
-
128
-
129
-
130
-
131
-
132
-
133
-
134
-
135
-
136
-
137
-
138
-
139
-
140
-
141
-
142
-
143
-
144
-
145
-
146
-
147
-
148
-
149
-
150
-
151
-
152
-
153
-
154
-
155
-
156
-
157
-
158
-
159
-
160
-
161
-
162
-
163
-
164
-
165
-
166
-
167
-
168
-
169
-
170
-
171
-
172
-
173
-
174
-
175
-
176
-
177
-
178
-
179
-
180
-
181
-
182
-
183
-
184
-
185
-
186
-
187
-
188
-
189
-
190
-
191
-
192
-
193
-
194
-
195
-
196
-
197
-
198
-
199
-
200
-
201
-
202
-
203
-
204
-
205
-
206
-
207
-
208
-
209
-
210
-
211
-
212
-
213
-
214
-
215
-
216
-
217
-
218
-
219
-
220
-
221
-
222
-
223
-
224
-
225
-
226
-
227
-
228
-
229
-
230
-
231
-
232
-
233
-
234
-
235
-
236
-
237
-
238
-
239
-
240
-
241
-
242
-
243
-
244
-
245
-
246
-
247
-
248
-
249
-
250
-
251
-
252
-
253
-
254
-
255
-
256
-
257
-
258
-
259
-
260
-
261
-
262
-
263
-
264
-
265
-
266
-
267
-
268
 |
 |
Group Management Report – Financial Review
107
2014
/
03.2
/
adidas Group
/
2014 Annual Report
Group Business Performance
/
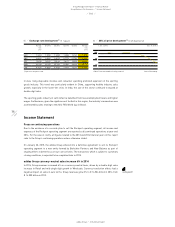
Income Statement
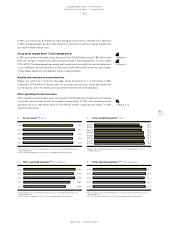
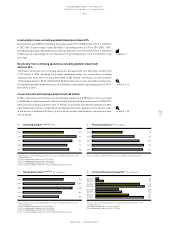
Group sales increase driven by strong growth in Wholesale and Retail
In 2014, currency-neutral Wholesale revenues increased 6%. While sales at adidas grew at a
mid-single-digit rate, revenues at Reebok remained stable compared to the prior year. Currency-
neutral Retail sales were up 21% versus the prior year as a result of double-digit sales increases at
adidas and Reebok. Revenues in Other Businesses were down 19% on a currency-neutral basis, due
to double-digit sales declines at TaylorMade-adidas Golf. Currency translation effects had a negative
impact on segmental sales in euro terms. Wholesale revenues increased 3% to € 9.376 billion in
2014 from € 9.100 billion in 2013. Retail sales rose 11% to € 3.842 billion versus € 3.446 billion
in the prior year. Sales in Other Businesses declined 21% to € 1.316 billion (2013: € 1.657 billion).
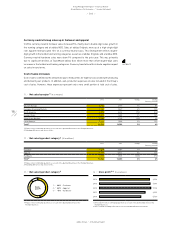
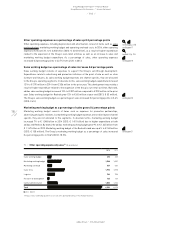
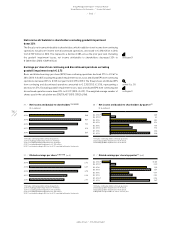
Currency-neutral sales grow in nearly all regions
In 2014, currency-neutral adidas Group sales grew in all regions except North America. Revenues
in Western Europe increased 8% on a currency-neutral basis, driven by strong sales growth in
Germany, the UK, France and Spain. In European Emerging Markets, Group sales were up 19% on
a currency-neutral basis, with double-digit sales increases in all of the region’s major markets.
Currency-neutral sales for the adidas Group in North America decreased 6%, mainly due to sales
declines in the USA. Sales in Greater China increased 10% on a currency-neutral basis. Currency-
neutral revenues in Other Asian Markets grew 2%, driven by sales increases in South Korea and
India. In Latin America, sales grew 19% on a currency-neutral basis with double-digit increases in
most markets, in particular Argentina, Mexico and Brazil. Currency translation effects had a mixed
impact on regional sales in euro terms.
see Table 11
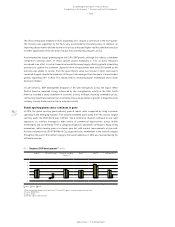
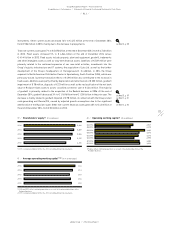
07
/
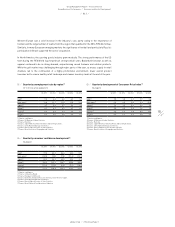
Net sales 1) 2) (€ in millions)
2014 14,534
2013 14,203
2012 14,883
2011 13,322
2010 11,990
1) 2014 and 2013 reflect continuing operations as a result of the planned divestiture of the
Rockport business.
2) 2011 restated according to IAS 8 in the 2012 consolidated financial statements.
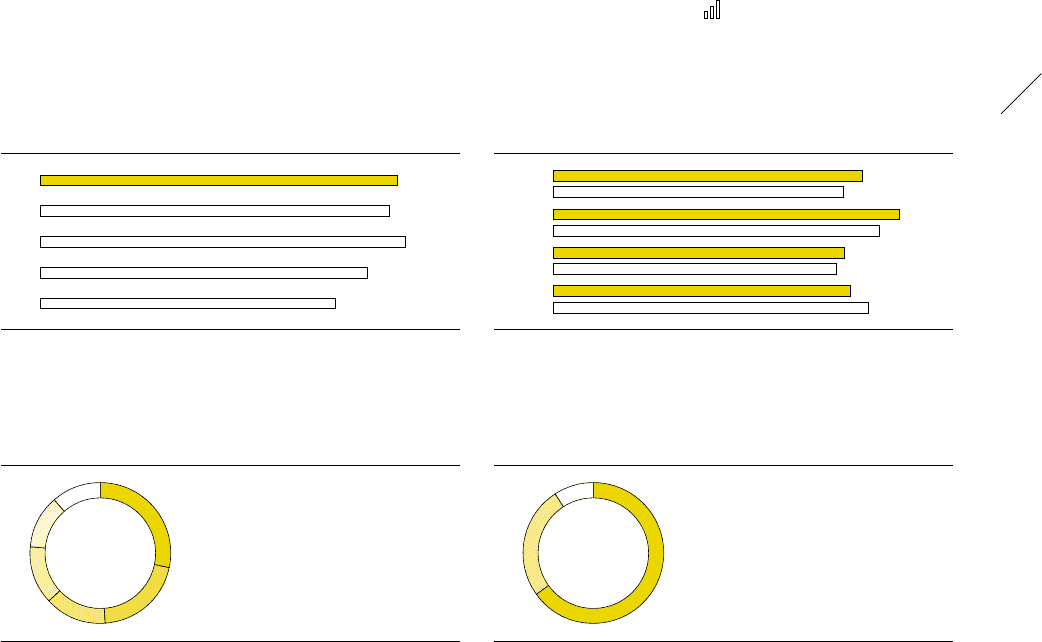
10
/
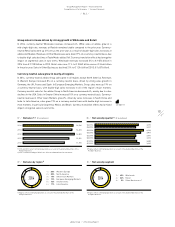
Net sales by segment
1) Figures reflect continuing operations as a result of the planned divestiture of the
Rockport business.
1
/
65% Wholesale
2
/
26% Retail
3
/
9% Other Businesses 1)
09
/
Net sales by region 1)
1) Figures reflect continuing operations as a result of the planned divestiture of the
Rockport business.
1
/
28% Western Europe
2
/
20% North America
3
/
14% Other Asian Markets
4
/
13% European Emerging Markets
5
/
12% Greater China
6
/
11% Latin America
08
/
Net sales by quarter 1) (€ in millions)
Q4 2014 3,610
Q4 2013 3,391
Q3 2014 4,044
Q3 2013 3,807
Q2 2014 3,400
Q2 2013 3,314
Q1 2014 3,480
Q1 2013 3,690
1) Figures reflect continuing operations as a result of the planned divestiture of the
Rockport business.
2014
1
2
3
2014
6
5 1
2
3
4