Reebok 2014 Annual Report Download - page 2
Download and view the complete annual report
Please find page 2 of the 2014 Reebok annual report below. You can navigate through the pages in the report by either clicking on the pages listed below, or by using the keyword search tool below to find specific information within the annual report.-
 1
1 -
 2
2 -
 3
3 -
 4
4 -
 5
5 -
 6
6 -
 7
7 -
 8
8 -
 9
9 -
 10
10 -
 11
11 -
 12
12 -
 13
13 -
14
-
15
-
16
-
17
-
18
-
19
-
20
-
21
-
22
-
23
-
24
-
25
-
26
-
27
-
28
-
29
-
30
-
31
-
32
-
33
-
34
-
35
-
36
-
37
-
38
-
39
-
40
-
41
-
42
-
43
-
44
-
45
-
46
-
47
-
48
-
49
-
50
-
51
-
52
-
53
-
54
-
55
-
56
-
57
-
58
-
59
-
60
-
61
-
62
-
63
-
64
-
65
-
66
-
67
-
68
-
69
-
70
-
71
-
72
-
73
-
74
-
75
-
76
-
77
-
78
-
79
-
80
-
81
-
82
-
83
-
84
-
85
-
86
-
87
-
88
-
89
-
90
-
91
-
92
-
93
-
94
-
95
-
96
-
97
-
98
-
99
-
100
-
101
-
102
-
103
-
104
-
105
-
106
-
107
-
108
-
109
-
110
-
111
-
112
-
113
-
114
-
115
-
116
-
117
-
118
-
119
-
120
-
121
-
122
-
123
-
124
-
125
-
126
-
127
-
128
-
129
-
130
-
131
-
132
-
133
-
134
-
135
-
136
-
137
-
138
-
139
-
140
-
141
-
142
-
143
-
144
-
145
-
146
-
147
-
148
-
149
-
150
-
151
-
152
-
153
-
154
-
155
-
156
-
157
-
158
-
159
-
160
-
161
-
162
-
163
-
164
-
165
-
166
-
167
-
168
-
169
-
170
-
171
-
172
-
173
-
174
-
175
-
176
-
177
-
178
-
179
-
180
-
181
-
182
-
183
-
184
-
185
-
186
-
187
-
188
-
189
-
190
-
191
-
192
-
193
-
194
-
195
-
196
-
197
-
198
-
199
-
200
-
201
-
202
-
203
-
204
-
205
-
206
-
207
-
208
-
209
-
210
-
211
-
212
-
213
-
214
-
215
-
216
-
217
-
218
-
219
-
220
-
221
-
222
-
223
-
224
-
225
-
226
-
227
-
228
-
229
-
230
-
231
-
232
-
233
-
234
-
235
-
236
-
237
-
238
-
239
-
240
-
241
-
242
-
243
-
244
-
245
-
246
-
247
-
248
-
249
-
250
-
251
-
252
-
253
-
254
-
255
-
256
-
257
-
258
-
259
-
260
-
261
-
262
-
263
-
264
-
265
-
266
-
267
-
268
 |
 |
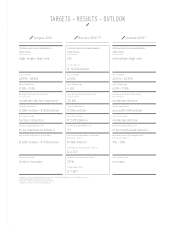
TARGETS – RESULTS – OUTLOOK
Targets 2014 Results 2014 1) 2) Outlook 2015 1)
Currency-neutral sales development:
adidas Group
increase at a
high-single-digit rate
Currency-neutral sales development:
adidas Group
increase of
6%
Group sales of
€ 14.534 billion
Currency-neutral sales development:
adidas Group
increase at a
mid-single-digit rate
Gross margin
49.5% – 49.8%
Gross margin
47.6%
Gross margin
47.5 % – 48.5 %
Operating margin
8.5% – 9.0%
Operating margin
6.6%
Operating margin
6.5% – 7.0%
Average operating working capital
(in % of sales)
moderate decline expected
Average operating working capital
(in % of sales)
22.4%
Average operating working capital
(in % of sales)
moderate decline
Capital expenditure
€ 500 million – € 550 million
Capital expenditure
€ 554 million
Capital expenditure
around € 600 million
Gross borrowings
further reduction
Gross borrowings
€ 1.873 billion
Gross borrowings
moderate decline
Net borrowings/EBITDA ratio
to be maintained below 2
Net borrowings/EBITDA ratio
0.1
Net borrowings/EBITDA ratio
to be maintained below 2
Net income attributable to shareholders
€ 830 million – € 930 million
Net income attributable to shareholders
decreases 32% to
€ 568 million 3)
Earnings per share decrease 32% to
€ 2.72 3)
Net income from continuing operations
increase at a rate of
7% – 10%
Shareholder value
further increase
adidas AG share price decreases
38 %
Dividend per share
€ 1.50 4)
Shareholder value
increase
1) Figures refl ect continuing operations as a result of the planned divestiture of the Rockport business.
2) Excluding goodwill impairment of € 78 million
3) Includes continuing and discontinued operations.
4) Subject to Annual General Meeting approval.