Reebok 2014 Annual Report Download - page 181
Download and view the complete annual report
Please find page 181 of the 2014 Reebok annual report below. You can navigate through the pages in the report by either clicking on the pages listed below, or by using the keyword search tool below to find specific information within the annual report.-
 1
1 -
2
-
3
-
4
-
5
-
6
-
7
-
8
-
9
-
10
-
11
-
12
-
13
-
14
-
15
-
16
-
17
-
18
-
19
-
20
-
21
-
22
-
23
-
24
-
25
-
26
-
27
-
28
-
29
-
30
-
31
-
32
-
33
-
34
-
35
-
36
-
37
-
38
-
39
-
40
-
41
-
42
-
43
-
44
-
45
-
46
-
47
-
48
-
49
-
50
-
51
-
52
-
53
-
54
-
55
-
56
-
57
-
58
-
59
-
60
-
61
-
62
-
63
-
64
-
65
-
66
-
67
-
68
-
69
-
70
-
71
-
72
-
73
-
74
-
75
-
76
-
77
-
78
-
79
-
80
-
81
-
82
-
83
-
84
-
85
-
86
-
87
-
88
-
89
-
90
-
91
-
92
-
93
-
94
-
95
-
96
-
97
-
98
-
99
-
100
-
101
-
102
-
103
-
104
-
105
-
106
-
107
-
108
-
109
-
110
-
111
-
112
-
113
-
114
-
115
-
116
-
117
-
118
-
119
-
120
-
121
-
122
-
123
-
124
-
125
-
126
-
127
-
128
-
129
-
130
-
131
-
132
-
133
-
134
-
135
-
136
-
137
-
138
-
139
-
140
-
141
-
142
-
143
-
144
-
145
-
146
-
147
-
148
-
149
-
150
-
151
-
152
-
153
-
154
-
155
-
156
-
157
-
158
-
159
-
160
-
161
-
162
-
163
-
164
-
165
-
166
-
167
-
168
-
169
-
170
-
 171
171 -
 172
172 -
 173
173 -
 174
174 -
 175
175 -
 176
176 -
 177
177 -
 178
178 -
 179
179 -
 180
180 -
 181
181 -
 182
182 -
 183
183 -
 184
184 -
 185
185 -
 186
186 -
 187
187 -
 188
188 -
 189
189 -
 190
190 -
 191
191 -
192
-
193
-
194
-
195
-
196
-
197
-
198
-
199
-
200
-
201
-
202
-
203
-
204
-
205
-
206
-
207
-
208
-
209
-
210
-
211
-
212
-
213
-
214
-
215
-
216
-
217
-
218
-
219
-
220
-
221
-
222
-
223
-
224
-
225
-
226
-
227
-
228
-
229
-
230
-
231
-
232
-
233
-
234
-
235
-
236
-
237
-
238
-
239
-
240
-
241
-
242
-
243
-
244
-
245
-
246
-
247
-
248
-
249
-
250
-
251
-
252
-
253
-
254
-
255
-
256
-
257
-
258
-
259
-
260
-
261
-
262
-
263
-
264
-
265
-
266
-
267
-
268
 |
 |
Group Management Report – Financial Review
177
2014
/
03.5
/
adidas Group
/
2014 Annual Report
Risk and Opportunity Report
/
Financial Risks
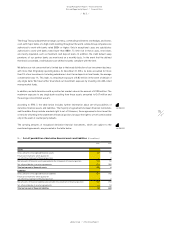
Financing and liquidity risks
Liquidity risks arise from not having the necessary resources available to meet maturing liabilities
with regard to timing, volume and currency structure. In addition, the adidas Group faces the risk
of having to accept unfavourable financing terms due to liquidity restraints. Our Group Treasury
department uses an efficient cash management system to manage liquidity risk. At December 31,
2014, Group cash and cash equivalents together with marketable securities amounted to
€ 1.688 billion (2013: € 1.629 billion). Moreover, our Group maintains € 1.520 billion bilateral credit
lines and a € 500 million committed long-term syndicated loan facility with international banks,
which does not include a market disruption clause. The € 2.020 billion in credit lines are designed
to ensure sufficient liquidity at all times.
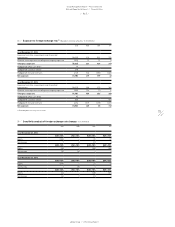
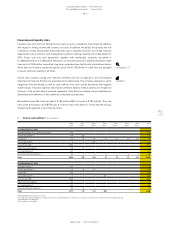
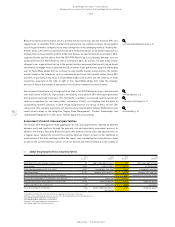
Future cash outflows arising from financial liabilities that are recognised in the Consolidated
Statement of Financial Position are presented in the table below. This includes payments to settle
obligations from borrowings as well as cash outflows from cash-settled derivatives with negative
market values. Financial liabilities that may be settled in advance without penalty are included on
the basis of the earliest date of potential repayment. Cash flows for variable-interest liabilities are
determined with reference to the conditions at the balance sheet date.
We ended the year 2014 with net debt of € 185 million (2013: net cash of € 295 million). Thus, the
ratio of net borrowings over EBITDA was 0.1 times at year-end, which is in line with the Group’s
medium-term guideline of less than two times.
see Treasury, p. 121
see Table 07
07
/
Future cash outflows 1) (€ in millions)
Up to
1 year
Up to
2 years
Up to
3 years
Up to
4 years
Up to
5 years
Up to
6 years
Up to
7 years
Total
As at December 31, 2014
Bank borrowings incl. commercial paper 2) 194 194
Private placements 3) 108 127 235
Eurobond 3) 17 17 17 17 17 17 617 719
Convertible bond 3) 1 1 502 504
Accounts payable 1,652 1,652
Other financial liabilities 38 7 44
Accrued liabilities 4) 491 491
Derivative financial liabilities 53 0 0 0 0 0 0 55
Total 2,554 152 519 17 17 17 617 3,894
As at December 31, 2013
Bank borrowings 2) 126 126
Private placements 3) 70 95 111 276
Eurobond 3) 514 514
Convertible bond 3) 1 1 1 502 505
Accounts payable 1,825 1,825
Other financial liabilities 33 9 42
Accrued liabilities 4) 464 464
Derivative financial liabilities 80 12 1 93
Total 3,113 117 113 502 3,845
1) Rounding difference may arise in totals.
2) Classified as long-term (between 1 and 3 years) in the consolidated financial statements, as they are covered by the committed mid-term syndicated loan.
3) Including interest payments.
4) Accrued interest excluded.