Reebok 2014 Annual Report Download - page 129
Download and view the complete annual report
Please find page 129 of the 2014 Reebok annual report below. You can navigate through the pages in the report by either clicking on the pages listed below, or by using the keyword search tool below to find specific information within the annual report.-
 1
1 -
2
-
3
-
4
-
5
-
6
-
7
-
8
-
9
-
10
-
11
-
12
-
13
-
14
-
15
-
16
-
17
-
18
-
19
-
20
-
21
-
22
-
23
-
24
-
25
-
26
-
27
-
28
-
29
-
30
-
31
-
32
-
33
-
34
-
35
-
36
-
37
-
38
-
39
-
40
-
41
-
42
-
43
-
44
-
45
-
46
-
47
-
48
-
49
-
50
-
51
-
52
-
53
-
54
-
55
-
56
-
57
-
58
-
59
-
60
-
61
-
62
-
63
-
64
-
65
-
66
-
67
-
68
-
69
-
70
-
71
-
72
-
73
-
74
-
75
-
76
-
77
-
78
-
79
-
80
-
81
-
82
-
83
-
84
-
85
-
86
-
87
-
88
-
89
-
90
-
91
-
92
-
93
-
94
-
95
-
96
-
97
-
98
-
99
-
100
-
101
-
102
-
103
-
104
-
105
-
106
-
107
-
108
-
109
-
110
-
111
-
112
-
113
-
114
-
115
-
116
-
117
-
118
-
 119
119 -
 120
120 -
 121
121 -
 122
122 -
 123
123 -
 124
124 -
 125
125 -
 126
126 -
 127
127 -
 128
128 -
 129
129 -
 130
130 -
 131
131 -
 132
132 -
 133
133 -
 134
134 -
 135
135 -
 136
136 -
 137
137 -
 138
138 -
 139
139 -
140
-
141
-
142
-
143
-
144
-
145
-
146
-
147
-
148
-
149
-
150
-
151
-
152
-
153
-
154
-
155
-
156
-
157
-
158
-
159
-
160
-
161
-
162
-
163
-
164
-
165
-
166
-
167
-
168
-
169
-
170
-
171
-
172
-
173
-
174
-
175
-
176
-
177
-
178
-
179
-
180
-
181
-
182
-
183
-
184
-
185
-
186
-
187
-
188
-
189
-
190
-
191
-
192
-
193
-
194
-
195
-
196
-
197
-
198
-
199
-
200
-
201
-
202
-
203
-
204
-
205
-
206
-
207
-
208
-
209
-
210
-
211
-
212
-
213
-
214
-
215
-
216
-
217
-
218
-
219
-
220
-
221
-
222
-
223
-
224
-
225
-
226
-
227
-
228
-
229
-
230
-
231
-
232
-
233
-
234
-
235
-
236
-
237
-
238
-
239
-
240
-
241
-
242
-
243
-
244
-
245
-
246
-
247
-
248
-
249
-
250
-
251
-
252
-
253
-
254
-
255
-
256
-
257
-
258
-
259
-
260
-
261
-
262
-
263
-
264
-
265
-
266
-
267
-
268
 |
 |
Group Management Report – Financial Review
125
2014
/
03.2
/
adidas Group
/
2014 Annual Report
Group Business Performance
/
Treasury
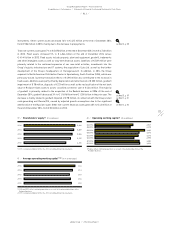
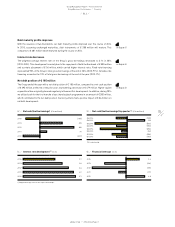
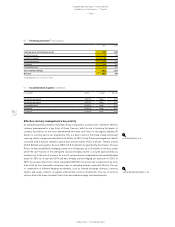
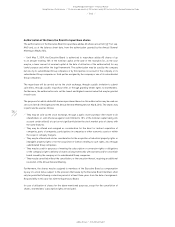
Debt maturity profile improves
With the issuance of two Eurobonds, our debt maturity profile improved over the course of 2014.
In 2015, assuming unchanged maturities, debt instruments of € 288 million will mature. This
compares to € 681 million which matured during the course of 2014.
Interest rate decreases
The weighted average interest rate on the Group’s gross borrowings decreased to 3.1% in 2014
(2013: 3.8%). This development is mainly due to the repayment of both the Eurobond of € 500 million
and a private placement of € 56 million, which carried higher interest rates. Fixed-rate financing
represented 90% of the Group’s total gross borrowings at the end of 2014 (2013: 91%). Variable-rate
financing accounted for 10% of total gross borrowings at the end of the year (2013: 9%).
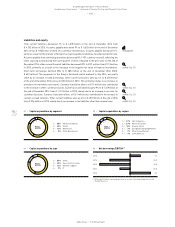
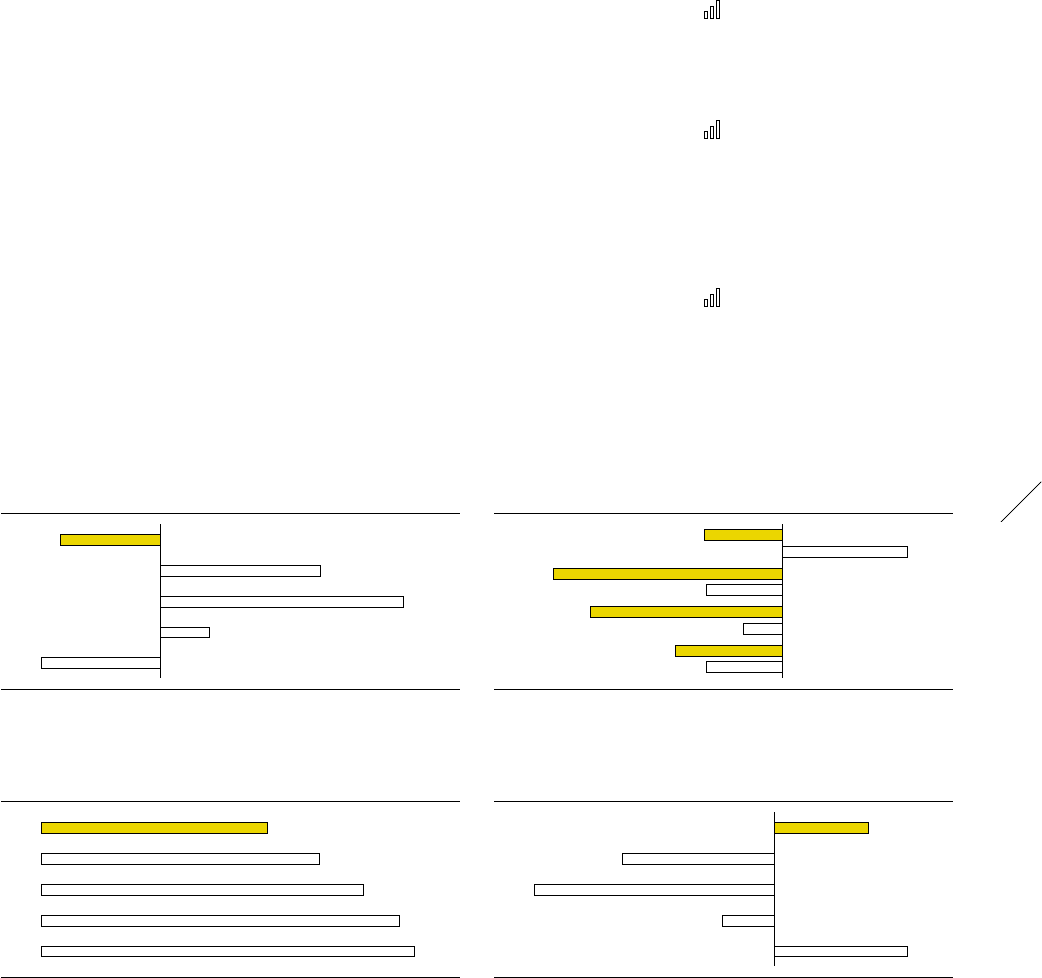
Net debt position of € 185 million
The Group ended the year with a net debt position of € 185 million, compared to a net cash position
of € 295 million at the end of the prior year, representing a decrease of € 479 million. Higher capital
expenditure than originally planned negatively influenced this development. In addition, during 2014
we utilised cash for the first tranche of our share buyback programme in an amount of € 300 million,
which contributed to the net debt position. Currency effects had a positive impact of € 36 million on
net debt development.
see Diagram 51
see Diagram 54
see Diagram 52
52
/
Net cash/(net borrowings) (€ in millions)
2014 (185)
2013 295
2012 448
2011 90
2010 (221)
54
/
Interest rate development 1) (in %)
2014 3.1
2013 3.8
2012 4.4
2011 4.9
2010 5.1
1) Weighted average interest rate of gross borrowings.
53
/
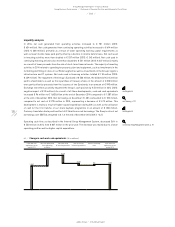
Net cash/(net borrowings) by quarter 1) (€ in millions)
Q4 2014 (185)
Q4 2013 295
Q3 2014 (543)
Q3 2013 (180)
Q2 2014 (454)
Q2 2013 (94)
Q1 2014 (254)
Q1 2013 (180)
1) At end of period.
55
/
Financial leverage (in %)
2014 3.3
2013 (5.4)
2012 (8.5)
2011 (1.7)
2010 4.8