Reebok 2014 Annual Report Download - page 133
Download and view the complete annual report
Please find page 133 of the 2014 Reebok annual report below. You can navigate through the pages in the report by either clicking on the pages listed below, or by using the keyword search tool below to find specific information within the annual report.-
 1
1 -
2
-
3
-
4
-
5
-
6
-
7
-
8
-
9
-
10
-
11
-
12
-
13
-
14
-
15
-
16
-
17
-
18
-
19
-
20
-
21
-
22
-
23
-
24
-
25
-
26
-
27
-
28
-
29
-
30
-
31
-
32
-
33
-
34
-
35
-
36
-
37
-
38
-
39
-
40
-
41
-
42
-
43
-
44
-
45
-
46
-
47
-
48
-
49
-
50
-
51
-
52
-
53
-
54
-
55
-
56
-
57
-
58
-
59
-
60
-
61
-
62
-
63
-
64
-
65
-
66
-
67
-
68
-
69
-
70
-
71
-
72
-
73
-
74
-
75
-
76
-
77
-
78
-
79
-
80
-
81
-
82
-
83
-
84
-
85
-
86
-
87
-
88
-
89
-
90
-
91
-
92
-
93
-
94
-
95
-
96
-
97
-
98
-
99
-
100
-
101
-
102
-
103
-
104
-
105
-
106
-
107
-
108
-
109
-
110
-
111
-
112
-
113
-
114
-
115
-
116
-
117
-
118
-
119
-
120
-
121
-
122
-
 123
123 -
 124
124 -
 125
125 -
 126
126 -
 127
127 -
 128
128 -
 129
129 -
 130
130 -
 131
131 -
 132
132 -
 133
133 -
 134
134 -
 135
135 -
 136
136 -
 137
137 -
 138
138 -
 139
139 -
 140
140 -
 141
141 -
 142
142 -
 143
143 -
144
-
145
-
146
-
147
-
148
-
149
-
150
-
151
-
152
-
153
-
154
-
155
-
156
-
157
-
158
-
159
-
160
-
161
-
162
-
163
-
164
-
165
-
166
-
167
-
168
-
169
-
170
-
171
-
172
-
173
-
174
-
175
-
176
-
177
-
178
-
179
-
180
-
181
-
182
-
183
-
184
-
185
-
186
-
187
-
188
-
189
-
190
-
191
-
192
-
193
-
194
-
195
-
196
-
197
-
198
-
199
-
200
-
201
-
202
-
203
-
204
-
205
-
206
-
207
-
208
-
209
-
210
-
211
-
212
-
213
-
214
-
215
-
216
-
217
-
218
-
219
-
220
-
221
-
222
-
223
-
224
-
225
-
226
-
227
-
228
-
229
-
230
-
231
-
232
-
233
-
234
-
235
-
236
-
237
-
238
-
239
-
240
-
241
-
242
-
243
-
244
-
245
-
246
-
247
-
248
-
249
-
250
-
251
-
252
-
253
-
254
-
255
-
256
-
257
-
258
-
259
-
260
-
261
-
262
-
263
-
264
-
265
-
266
-
267
-
268
 |
 |

Group Management Report – Financial Review
129
2014
/
03.2
/
adidas Group
/
2014 Annual Report
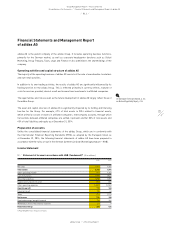
Group Business Performance
/
Financial Statements and Management Report of adidas AG
Financial result improves strongly
The financial result of adidas AG improved to € 128 million in 2014 from € 43 million in 2013.
This increase is due to lower interest paid to affiliated companies as well as higher income from
investments in affiliated companies in an amount of € 170 million (2013: € 102 million). This
includes the recognition of the dividend of the subsidiary in Korea in the same reporting period (date
of resolution: February 12, 2015) in an amount of € 72 million.
Net interest expense of adidas AG declined 29% to € 44 million in 2014 (2013: € 62 million). This was
mainly due to lower interest paid to affiliated companies.
Net income grows 76%
Income from ordinary activities increased 17% to € 247 million in 2014 from € 211 million in 2013.
This development is mainly attributable to the improved financial result, which more than offset
lower operating profit. Net income, after taxes of € 71 million, was € 176 million in 2014 and was
thus above the prior year level (2013: € 100 million).
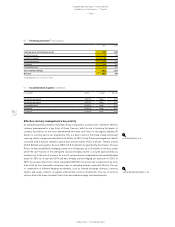
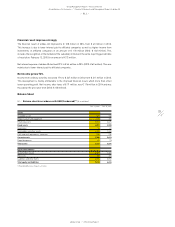
Balance Sheet
60
/
Balance sheet in accordance with HGB (Condensed) 1) (€ in millions)
Dec. 31, 2014 Dec. 31, 2013
Assets
Intangible assets 129 148
Property, plant and equipment 419 304
Financial assets 3,503 3,476
Fixed assets 4,051 3,928
Inventories 38 29
Receivables and other assets 2,312 1,928
Cash and cash equivalents, securities 934 736
Current assets 3,284 2,693
Prepaid expenses 80 73
Total assets 7,415 6,694
Equity and liabilities
Shareholders’ equity 2,051 2,489
Provisions 390 393
Liabilities and other items 4,974 3,812
Total equity and liabilities 7,415 6,694
1) Rounding differences may arise in totals.