Reebok 2014 Annual Report Download - page 92
Download and view the complete annual report
Please find page 92 of the 2014 Reebok annual report below. You can navigate through the pages in the report by either clicking on the pages listed below, or by using the keyword search tool below to find specific information within the annual report.-
 1
1 -
2
-
3
-
4
-
5
-
6
-
7
-
8
-
9
-
10
-
11
-
12
-
13
-
14
-
15
-
16
-
17
-
18
-
19
-
20
-
21
-
22
-
23
-
24
-
25
-
26
-
27
-
28
-
29
-
30
-
31
-
32
-
33
-
34
-
35
-
36
-
37
-
38
-
39
-
40
-
41
-
42
-
43
-
44
-
45
-
46
-
47
-
48
-
49
-
50
-
51
-
52
-
53
-
54
-
55
-
56
-
57
-
58
-
59
-
60
-
61
-
62
-
63
-
64
-
65
-
66
-
67
-
68
-
69
-
70
-
71
-
72
-
73
-
74
-
75
-
76
-
77
-
78
-
79
-
80
-
81
-
 82
82 -
 83
83 -
 84
84 -
 85
85 -
 86
86 -
 87
87 -
 88
88 -
 89
89 -
 90
90 -
 91
91 -
 92
92 -
 93
93 -
 94
94 -
 95
95 -
 96
96 -
 97
97 -
 98
98 -
 99
99 -
 100
100 -
 101
101 -
 102
102 -
103
-
104
-
105
-
106
-
107
-
108
-
109
-
110
-
111
-
112
-
113
-
114
-
115
-
116
-
117
-
118
-
119
-
120
-
121
-
122
-
123
-
124
-
125
-
126
-
127
-
128
-
129
-
130
-
131
-
132
-
133
-
134
-
135
-
136
-
137
-
138
-
139
-
140
-
141
-
142
-
143
-
144
-
145
-
146
-
147
-
148
-
149
-
150
-
151
-
152
-
153
-
154
-
155
-
156
-
157
-
158
-
159
-
160
-
161
-
162
-
163
-
164
-
165
-
166
-
167
-
168
-
169
-
170
-
171
-
172
-
173
-
174
-
175
-
176
-
177
-
178
-
179
-
180
-
181
-
182
-
183
-
184
-
185
-
186
-
187
-
188
-
189
-
190
-
191
-
192
-
193
-
194
-
195
-
196
-
197
-
198
-
199
-
200
-
201
-
202
-
203
-
204
-
205
-
206
-
207
-
208
-
209
-
210
-
211
-
212
-
213
-
214
-
215
-
216
-
217
-
218
-
219
-
220
-
221
-
222
-
223
-
224
-
225
-
226
-
227
-
228
-
229
-
230
-
231
-
232
-
233
-
234
-
235
-
236
-
237
-
238
-
239
-
240
-
241
-
242
-
243
-
244
-
245
-
246
-
247
-
248
-
249
-
250
-
251
-
252
-
253
-
254
-
255
-
256
-
257
-
258
-
259
-
260
-
261
-
262
-
263
-
264
-
265
-
266
-
267
-
268
 |
 |
adidas Group
/
2014 Annual Report
Group Management Report – Our Group
88
2014
Employees
/
02.7
/
05
/
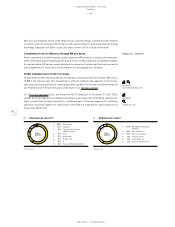
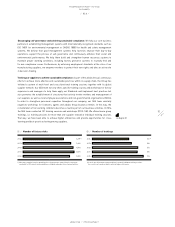
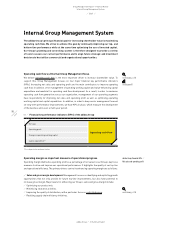
Employees by function 1)
1) At year-end.
1
/
59% Own retail
2
/
11% Logistics
3
/
9% Central functions &
administration
4
/
7% Sales
5
/
7% Marketing
6
/
3% Production
7
/
2% IT
8
/
2% Research & development
06
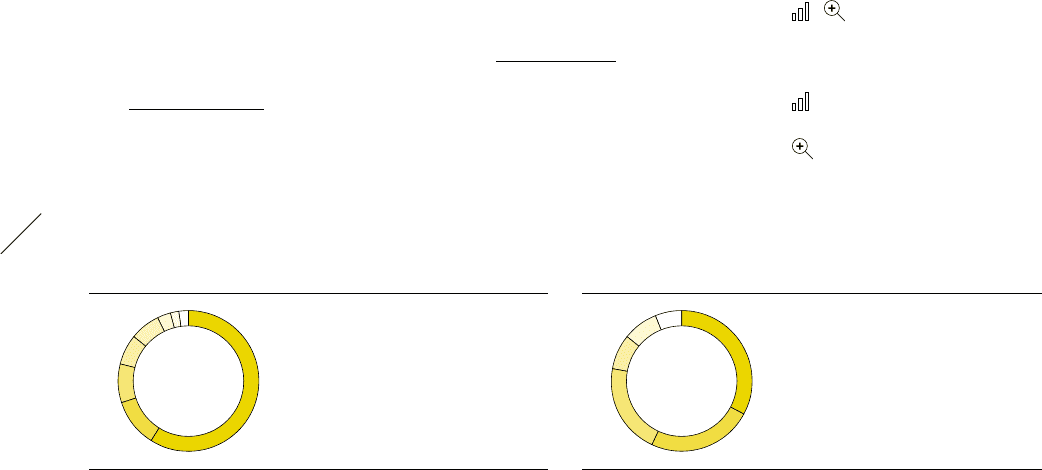
/
Employees by region 1)
1) At year-end.
1
/
33% European Emerging
Markets
2
/
24% North America
3
/
21% Western Europe
4
/
8% Greater China
5
/
8% Latin America
6
/
6% Other Asian Markets
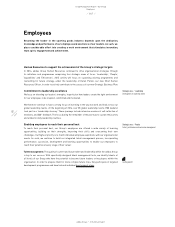
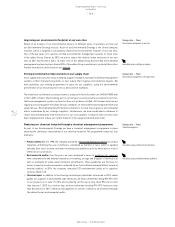
2014 also saw the global launch of the adidas Group ‘Learning Campus’ and with that the activation
of a state-of-the-art learning platform that provides opportunities for both e-learning and sharing
knowledge. Employees are able to access and share content 24/7 in a virtual environment.
Commitment to drive efficiency through HR processes
We are committed to establishing lean, system-supported HR processes to unleash efficiency gains
while continuing to support employees with quality service. In 2014, therefore, we laid the foundation
for a global adidas HR Services model, designed core processes, systems and tools and carried out
pilot programmes for the model at our headquarters in Herzogenaurach, Germany.
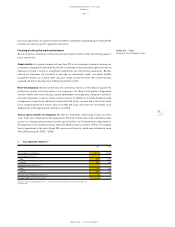
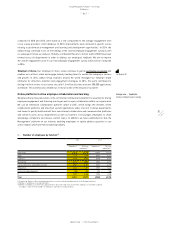
Global employee base further increases
On December 31, 2014, the Group had 53,731 employees, which represents an increase of 8% versus
49,808 in the previous year. This development is primarily related to the expansion of the Group’s
own-retail store base, particularly in emerging markets globally. An overview of the development of
our employee base in the past ten years can be found in our ten-year overview.
On a full-time equivalent basis, our Group had 45,917 employees on December 31, 2014 (2013:
42,758). Due to the high share of employees working on a part-time basis in the Retail segment, this
figure is lower than the figure reported on a headcount basis. Personnel expenses for continuing
operations increased slightly to € 1.842 billion in 2014 (2013: € 1.833 billion), representing 13% of
Group sales (2013: 13%).
Strategic area
/
Efficiencies
see Table 04
see Ten-Year Overview, p. 254
see Table 04
see Note 32, p. 235
2014 1
2
3
4
5 6 7 8
2014
1
2
3
6
4
5