Reebok 2014 Annual Report Download - page 122
Download and view the complete annual report
Please find page 122 of the 2014 Reebok annual report below. You can navigate through the pages in the report by either clicking on the pages listed below, or by using the keyword search tool below to find specific information within the annual report.-
 1
1 -
2
-
3
-
4
-
5
-
6
-
7
-
8
-
9
-
10
-
11
-
12
-
13
-
14
-
15
-
16
-
17
-
18
-
19
-
20
-
21
-
22
-
23
-
24
-
25
-
26
-
27
-
28
-
29
-
30
-
31
-
32
-
33
-
34
-
35
-
36
-
37
-
38
-
39
-
40
-
41
-
42
-
43
-
44
-
45
-
46
-
47
-
48
-
49
-
50
-
51
-
52
-
53
-
54
-
55
-
56
-
57
-
58
-
59
-
60
-
61
-
62
-
63
-
64
-
65
-
66
-
67
-
68
-
69
-
70
-
71
-
72
-
73
-
74
-
75
-
76
-
77
-
78
-
79
-
80
-
81
-
82
-
83
-
84
-
85
-
86
-
87
-
88
-
89
-
90
-
91
-
92
-
93
-
94
-
95
-
96
-
97
-
98
-
99
-
100
-
101
-
102
-
103
-
104
-
105
-
106
-
107
-
108
-
109
-
110
-
111
-
 112
112 -
 113
113 -
 114
114 -
 115
115 -
 116
116 -
 117
117 -
 118
118 -
 119
119 -
 120
120 -
 121
121 -
 122
122 -
 123
123 -
 124
124 -
 125
125 -
 126
126 -
 127
127 -
 128
128 -
 129
129 -
 130
130 -
 131
131 -
 132
132 -
133
-
134
-
135
-
136
-
137
-
138
-
139
-
140
-
141
-
142
-
143
-
144
-
145
-
146
-
147
-
148
-
149
-
150
-
151
-
152
-
153
-
154
-
155
-
156
-
157
-
158
-
159
-
160
-
161
-
162
-
163
-
164
-
165
-
166
-
167
-
168
-
169
-
170
-
171
-
172
-
173
-
174
-
175
-
176
-
177
-
178
-
179
-
180
-
181
-
182
-
183
-
184
-
185
-
186
-
187
-
188
-
189
-
190
-
191
-
192
-
193
-
194
-
195
-
196
-
197
-
198
-
199
-
200
-
201
-
202
-
203
-
204
-
205
-
206
-
207
-
208
-
209
-
210
-
211
-
212
-
213
-
214
-
215
-
216
-
217
-
218
-
219
-
220
-
221
-
222
-
223
-
224
-
225
-
226
-
227
-
228
-
229
-
230
-
231
-
232
-
233
-
234
-
235
-
236
-
237
-
238
-
239
-
240
-
241
-
242
-
243
-
244
-
245
-
246
-
247
-
248
-
249
-
250
-
251
-
252
-
253
-
254
-
255
-
256
-
257
-
258
-
259
-
260
-
261
-
262
-
263
-
264
-
265
-
266
-
267
-
268
 |
 |
118
2014
/
03.2
/
adidas Group
/
2014 Annual Report
Group Management Report – Financial Review
Group Business Performance
/
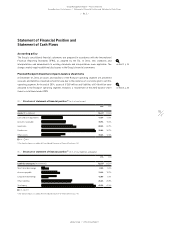
Statement of Financial Position and Statement of Cash Flows
Liabilities and equity
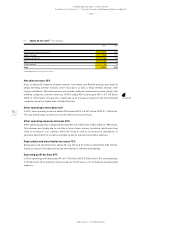
Total current liabilities decreased 7% to € 4.378 billion at the end of December 2014 from
€ 4.732 billion in 2013. Accounts payable were down 9% to € 1.652 billion at the end of December
2014 versus € 1.825 billion in 2013. On a currency-neutral basis, accounts payable decreased 11%,
partly as a result of the transfer of Rockport accounts payable to liabilities classified as held for sale.
Accounts payable from continuing operations decreased 8% (-10% currency-neutral), reflecting the
lower sourcing activity during the fourth quarter of 2014 compared to the prior year. At the end of
December 2014, other current financial liabilities decreased 20% to € 91 million from € 113 million
in 2013, primarily as a result of the decrease in the negative fair value of financial instruments.
Short-term borrowings declined 58% to € 288 million at the end of December 2014 (2013:
€ 681 million). The repayment of the Group’s Eurobond, which matured in July 2014, was partly
offset by an increase in bank borrowings. Other current provisions were up 4% to € 470 million
at the end of December 2014 versus € 450 million in 2013. This primarily relates to an increase in
provisions for warranties and returns. Currency translation effects of € 14 million also contributed
to the increase in other current provisions. Current accrued liabilities grew 9% to € 1.249 billion at
the end of December 2014 from € 1.147 billion in 2013, mainly due to an increase in accruals for
customer discounts. Currency translation effects of € 61 million also contributed to the increase in
current accrued liabilities. Other current liabilities were up 4% to € 287 million at the end of 2014
from € 276 million in 2013, mainly due to an increase in tax liabilities other than income taxes.
see Diagram 38
see Note 19, p. 215
see Note 20, p. 215
see Note 21, p. 216
see Note 22, p. 216
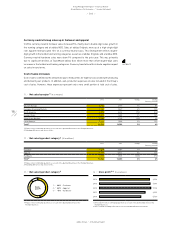
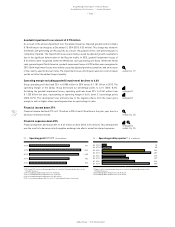
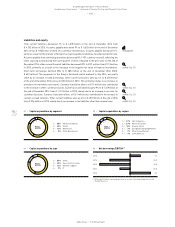
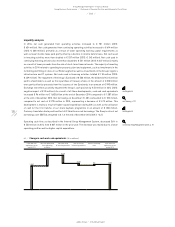
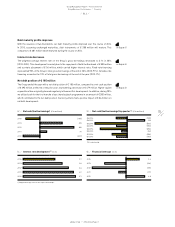
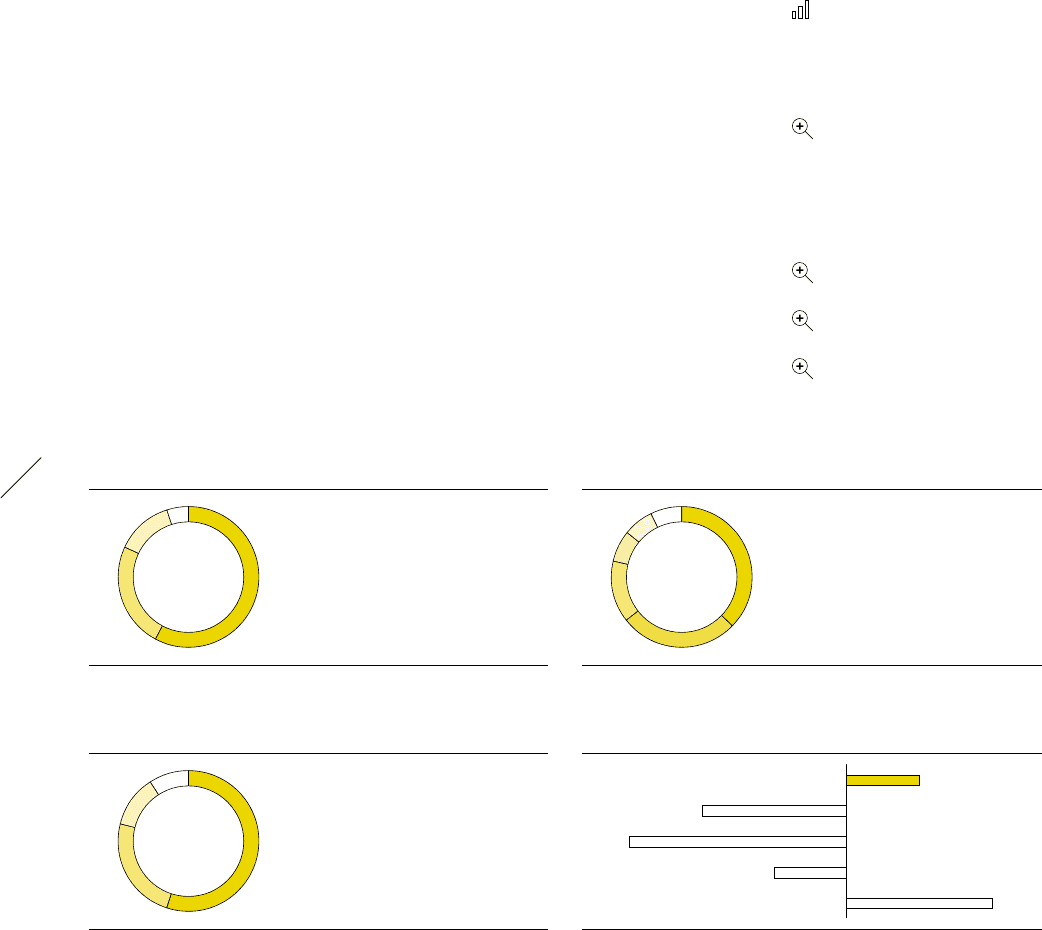
42
/
Capital expenditure by segment
43
/
Capital expenditure by region
2014 2014
1
/
58% HQ/Consolidation
2
/
24% Retail
3
/
13% Wholesale
4
/
5% Other Businesses
1
/
37% North America
2
/
27% Western Europe
3
/
14% Greater China
4
/
7% European Emerging Markets
5
/
7% Other Asian Markets
6
/
7% Latin America
1
1
2 3
2
3 5
4 6
4
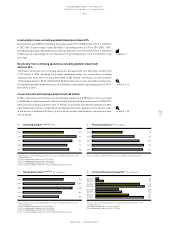
44
/
Capital expenditure by type
2014
1
/
55% Other
2
/
24% Own-retail activities
3
/
12% Retailer support
4
/
9% IT
1
2
3
4
45
/
Net borrowings/EBITDA 1)
2014 0.1
2013 (0.2)
2012 (0.3)
2011 (0.1)
2010 0.2
1) 2014 and 2013 reflect continuing operations as a result of the planned divestiture of the
Rockport business.