Reebok 2014 Annual Report Download - page 185
Download and view the complete annual report
Please find page 185 of the 2014 Reebok annual report below. You can navigate through the pages in the report by either clicking on the pages listed below, or by using the keyword search tool below to find specific information within the annual report.-
 1
1 -
2
-
3
-
4
-
5
-
6
-
7
-
8
-
9
-
10
-
11
-
12
-
13
-
14
-
15
-
16
-
17
-
18
-
19
-
20
-
21
-
22
-
23
-
24
-
25
-
26
-
27
-
28
-
29
-
30
-
31
-
32
-
33
-
34
-
35
-
36
-
37
-
38
-
39
-
40
-
41
-
42
-
43
-
44
-
45
-
46
-
47
-
48
-
49
-
50
-
51
-
52
-
53
-
54
-
55
-
56
-
57
-
58
-
59
-
60
-
61
-
62
-
63
-
64
-
65
-
66
-
67
-
68
-
69
-
70
-
71
-
72
-
73
-
74
-
75
-
76
-
77
-
78
-
79
-
80
-
81
-
82
-
83
-
84
-
85
-
86
-
87
-
88
-
89
-
90
-
91
-
92
-
93
-
94
-
95
-
96
-
97
-
98
-
99
-
100
-
101
-
102
-
103
-
104
-
105
-
106
-
107
-
108
-
109
-
110
-
111
-
112
-
113
-
114
-
115
-
116
-
117
-
118
-
119
-
120
-
121
-
122
-
123
-
124
-
125
-
126
-
127
-
128
-
129
-
130
-
131
-
132
-
133
-
134
-
135
-
136
-
137
-
138
-
139
-
140
-
141
-
142
-
143
-
144
-
145
-
146
-
147
-
148
-
149
-
150
-
151
-
152
-
153
-
154
-
155
-
156
-
157
-
158
-
159
-
160
-
161
-
162
-
163
-
164
-
165
-
166
-
167
-
168
-
169
-
170
-
171
-
172
-
173
-
174
-
 175
175 -
 176
176 -
 177
177 -
 178
178 -
 179
179 -
 180
180 -
 181
181 -
 182
182 -
 183
183 -
 184
184 -
 185
185 -
 186
186 -
 187
187 -
 188
188 -
 189
189 -
 190
190 -
 191
191 -
 192
192 -
 193
193 -
 194
194 -
 195
195 -
196
-
197
-
198
-
199
-
200
-
201
-
202
-
203
-
204
-
205
-
206
-
207
-
208
-
209
-
210
-
211
-
212
-
213
-
214
-
215
-
216
-
217
-
218
-
219
-
220
-
221
-
222
-
223
-
224
-
225
-
226
-
227
-
228
-
229
-
230
-
231
-
232
-
233
-
234
-
235
-
236
-
237
-
238
-
239
-
240
-
241
-
242
-
243
-
244
-
245
-
246
-
247
-
248
-
249
-
250
-
251
-
252
-
253
-
254
-
255
-
256
-
257
-
258
-
259
-
260
-
261
-
262
-
263
-
264
-
265
-
266
-
267
-
268
 |
 |
Group Management Report – Financial Review
181
2014
Management Assessment of Performance, Risks and Opportunities, and Outlook
/
03.6
/
adidas Group
/
2014 Annual Report
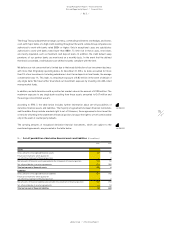
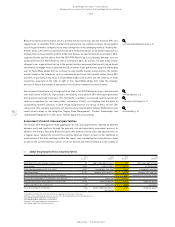
Assessment of performance versus targets
We communicate our Group’s financial targets on an annual basis. We also provide updates
throughout the year as appropriate. In 2014, the adidas Group results were significantly impacted
by a challenging golf market, geopolitical factors such as the crisis in Ukraine and its economic
consequences as well as volatile currency exchange rates. In particular, the continued depreciation
of several emerging market currencies versus the euro as well as the weakening of consumer
sentiment in Russia/CIS weighed on the Group’s financial performance. As a result, we lowered our
full year 2014 guidance in July, compared to our initial expectations.
In 2014, Group revenues rose 6% on a currency-neutral basis, driven by sales increases in both
Wholesale and Retail. Currency-neutral Group sales grew in all regions except North America, with a
particularly strong performance in the emerging markets. Nevertheless, Group revenues increased
slightly below our initial guidance of a high-single-digit currency-neutral increase. This was due
to double-digit sales declines at TaylorMade-adidas Golf. Gross margin decreased 1.7 percentage
points to 47.6% and was thus below our initial expectations of 49.5% to 49.8%. This development was
mainly due to negative currency effects, higher input costs, increased clearance activities in Russia/
CIS as well as lower product margins at TaylorMade-adidas Golf. Operating margin excluding
goodwill impairment losses declined 2.1 percentage points to 6.6%, below our initial guidance of
between 8.5% and 9.0%. This development was primarily due to the negative effects from the lower
gross margin as well as higher other operating expenses as a percentage of sales. As a result, net
income attributable to shareholders excluding goodwill impairment losses was € 568 million. While
this was below our initial guidance of between € 830 million and € 930 million, we have reached
our adjusted guidance of net income attributable to shareholders of around € 650 million, after
adjustment for the book loss in an amount of € 82 million resulting from the planned Rockport
divestiture.
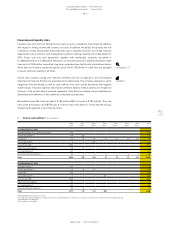
In 2014, operating working capital and cash management were negatively impacted by increased
working capital requirements at the beginning of the year. While we had initially expected average
operating working capital as a percentage of sales to decrease moderately in 2014, challenges in
Russia/CIS as well as at TaylorMade-adidas Golf resulted in higher inventories at the beginning of
the year. As a result, average operating working capital as a percentage of sales increased versus
the prior year and thus exceeded our initial expectations.
see Table 01
see Economic and Sector Development, p. 103
see Income Statement, p. 106
see Statement of Financial Position and Statement
of Cash Flows, p. 115
Management Assessment of
Performance, Risks and Opportunities,
and Outlook
6