Reebok 2014 Annual Report Download - page 207
Download and view the complete annual report
Please find page 207 of the 2014 Reebok annual report below. You can navigate through the pages in the report by either clicking on the pages listed below, or by using the keyword search tool below to find specific information within the annual report.-
 1
1 -
2
-
3
-
4
-
5
-
6
-
7
-
8
-
9
-
10
-
11
-
12
-
13
-
14
-
15
-
16
-
17
-
18
-
19
-
20
-
21
-
22
-
23
-
24
-
25
-
26
-
27
-
28
-
29
-
30
-
31
-
32
-
33
-
34
-
35
-
36
-
37
-
38
-
39
-
40
-
41
-
42
-
43
-
44
-
45
-
46
-
47
-
48
-
49
-
50
-
51
-
52
-
53
-
54
-
55
-
56
-
57
-
58
-
59
-
60
-
61
-
62
-
63
-
64
-
65
-
66
-
67
-
68
-
69
-
70
-
71
-
72
-
73
-
74
-
75
-
76
-
77
-
78
-
79
-
80
-
81
-
82
-
83
-
84
-
85
-
86
-
87
-
88
-
89
-
90
-
91
-
92
-
93
-
94
-
95
-
96
-
97
-
98
-
99
-
100
-
101
-
102
-
103
-
104
-
105
-
106
-
107
-
108
-
109
-
110
-
111
-
112
-
113
-
114
-
115
-
116
-
117
-
118
-
119
-
120
-
121
-
122
-
123
-
124
-
125
-
126
-
127
-
128
-
129
-
130
-
131
-
132
-
133
-
134
-
135
-
136
-
137
-
138
-
139
-
140
-
141
-
142
-
143
-
144
-
145
-
146
-
147
-
148
-
149
-
150
-
151
-
152
-
153
-
154
-
155
-
156
-
157
-
158
-
159
-
160
-
161
-
162
-
163
-
164
-
165
-
166
-
167
-
168
-
169
-
170
-
171
-
172
-
173
-
174
-
175
-
176
-
177
-
178
-
179
-
180
-
181
-
182
-
183
-
184
-
185
-
186
-
187
-
188
-
189
-
190
-
191
-
192
-
193
-
194
-
195
-
196
-
 197
197 -
 198
198 -
 199
199 -
 200
200 -
 201
201 -
 202
202 -
 203
203 -
 204
204 -
 205
205 -
 206
206 -
 207
207 -
 208
208 -
 209
209 -
 210
210 -
 211
211 -
 212
212 -
 213
213 -
 214
214 -
 215
215 -
 216
216 -
 217
217 -
218
-
219
-
220
-
221
-
222
-
223
-
224
-
225
-
226
-
227
-
228
-
229
-
230
-
231
-
232
-
233
-
234
-
235
-
236
-
237
-
238
-
239
-
240
-
241
-
242
-
243
-
244
-
245
-
246
-
247
-
248
-
249
-
250
-
251
-
252
-
253
-
254
-
255
-
256
-
257
-
258
-
259
-
260
-
261
-
262
-
263
-
264
-
265
-
266
-
267
-
268
 |
 |
adidas Group
/
2014 Annual Report
Consolidated Financial Statements
203
2014
Notes
/
04.8
/
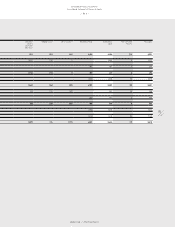
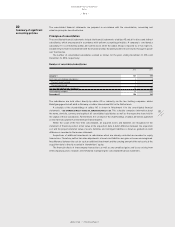
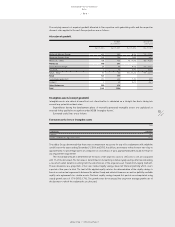
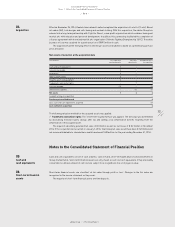
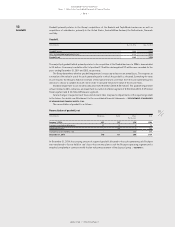
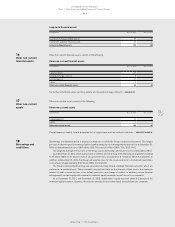
The carrying amounts of acquired goodwill allocated to the respective cash-generating units and the respective
discount rates applied to the cash flow projections are as follows:
Allocation of goodwill
Goodwill
(€ in millions)
Discount rate
(after taxes)
Dec. 31, 2014 Dec. 31, 2013 Dec. 31, 2014 Dec. 31, 2013
Wholesale Western Europe 422 389 8.1% 7.9 – 11.3%
Wholesale Greater China 168 156 7.8% 8.6%
Wholesale – Other 158 146 7.9 – 9.7% 8.7 – 10.5%
Wholesale 748 691
Retail Western Europe 59 55 8.1% 7.9 – 11.3%
Retail CIS 0 76 9.7% 10.4%
Retail – Other 71 66 7.8 – 11.2% 7.7 – 12.1%
Retail 131 197
TaylorMade-adidas Golf 290 288 7.3% 8.0%
Rockport 0 28 8.2% 8.4%
Other Businesses 290 316
Total 1,169 1,204
Intangible assets (except goodwill)
Intangible assets are valued at amortised cost. Amortisation is calculated on a straight-line basis taking into
account any potential residual value.
Expenditures during the development phase of internally generated intangible assets are capitalised as
incurred if they qualify for recognition under IAS 38 ‘Intangible Assets’.
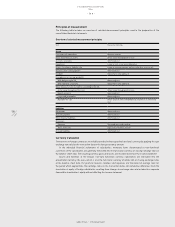
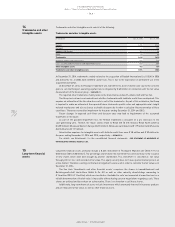
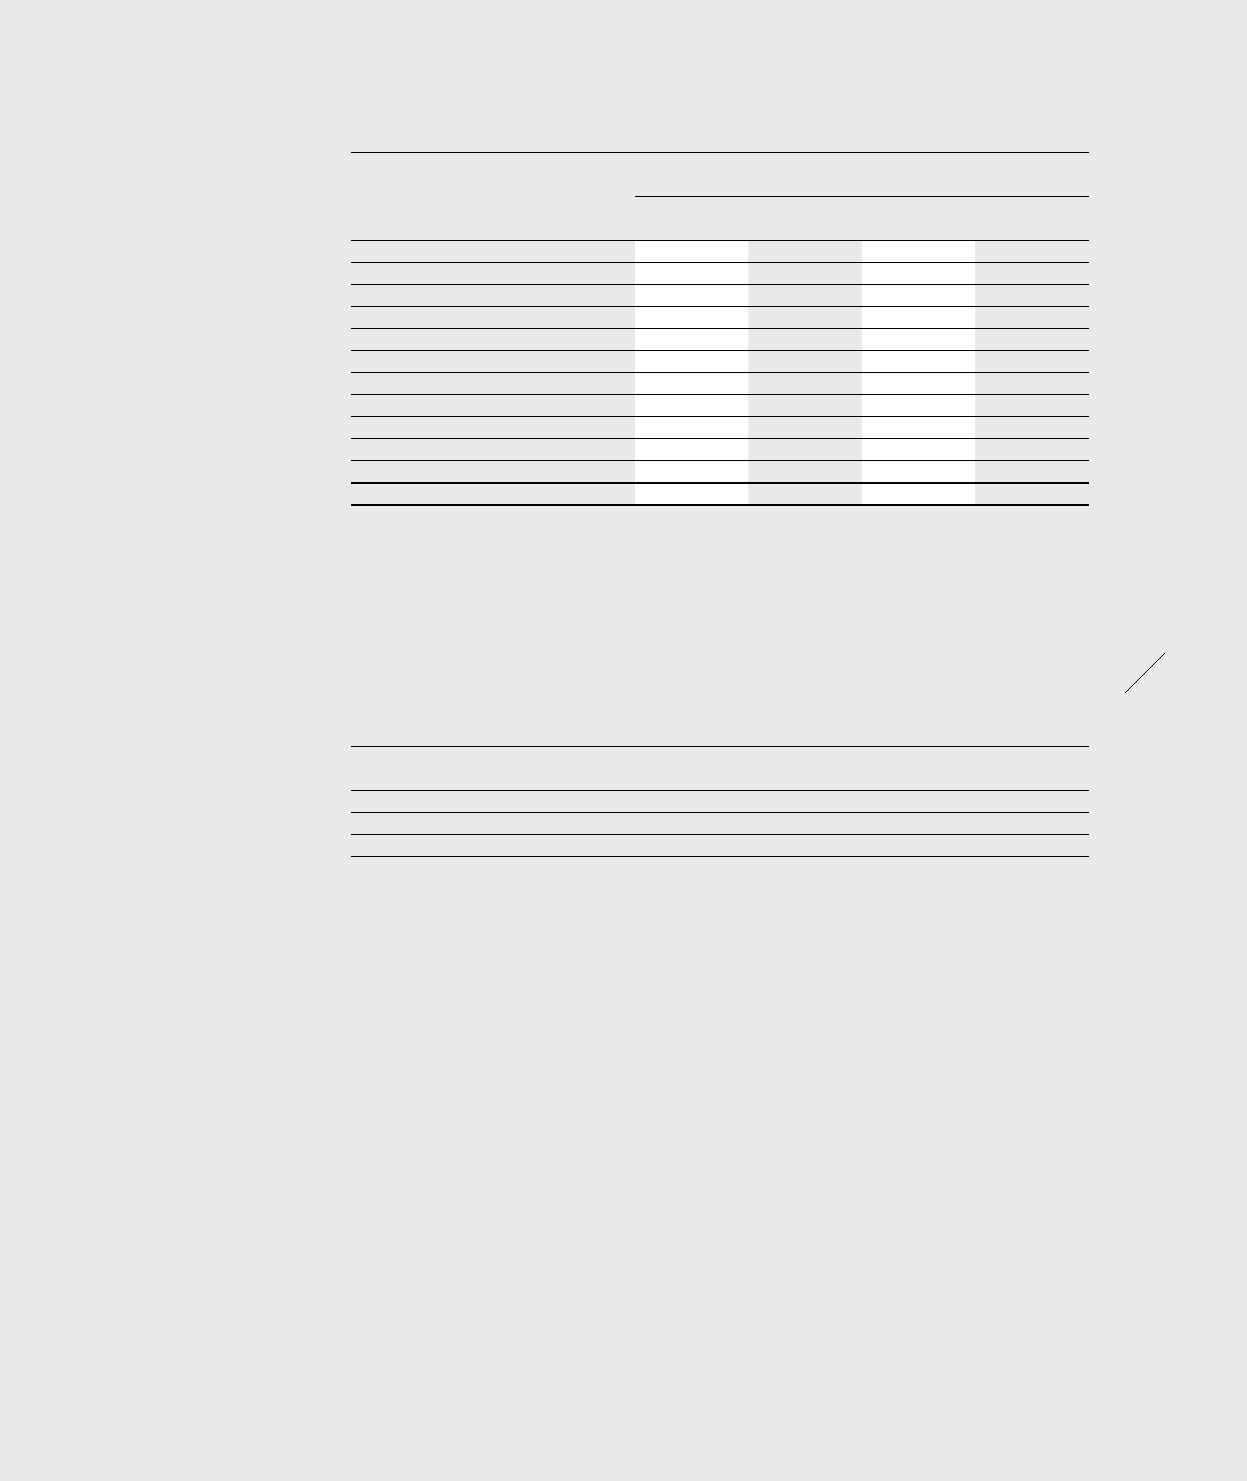
Estimated useful lives are as follows:
Estimated useful lives of intangible assets
Years
Trademarks indefinite
Software 5 – 7
Patents, trademarks and concessions 5 – 15
The adidas Group determined that there was no impairment necessary for any of its trademarks with indefinite
useful lives in the years ending December 31, 2014 and 2013. In addition, an increase in the discount rate of up to
approximately 1.5 percentage points or a reduction of cash inflows of up to approximately 20% would not result in
any impairment requirement.
The recoverable amount is determined on the basis of fair value less costs to sell (costs to sell are calculated
with 1% of the fair value). The fair value is determined in discounting notional royalty savings after tax and adding
a tax amortisation benefit, resulting from the amortisation of the acquired asset (‘relief-from-royalty method’).
These calculations use projections of net sales related royalty savings, based on financial planning which covers
a period of five years in total. The level of the applied royalty rate for the determination of the royalty savings is
based on contractual agreements between the adidas Group and external licensees as well as publicly available
royalty rate agreements for similar assets. Notional royalty savings beyond this period are extrapolated using
steady growth rates of 1.7% (2013: 1.7%). The growth rates do not exceed the long-term average growth rate of
the business to which the trademarks are allocated.