Reebok 2014 Annual Report Download - page 107
Download and view the complete annual report
Please find page 107 of the 2014 Reebok annual report below. You can navigate through the pages in the report by either clicking on the pages listed below, or by using the keyword search tool below to find specific information within the annual report.-
 1
1 -
2
-
3
-
4
-
5
-
6
-
7
-
8
-
9
-
10
-
11
-
12
-
13
-
14
-
15
-
16
-
17
-
18
-
19
-
20
-
21
-
22
-
23
-
24
-
25
-
26
-
27
-
28
-
29
-
30
-
31
-
32
-
33
-
34
-
35
-
36
-
37
-
38
-
39
-
40
-
41
-
42
-
43
-
44
-
45
-
46
-
47
-
48
-
49
-
50
-
51
-
52
-
53
-
54
-
55
-
56
-
57
-
58
-
59
-
60
-
61
-
62
-
63
-
64
-
65
-
66
-
67
-
68
-
69
-
70
-
71
-
72
-
73
-
74
-
75
-
76
-
77
-
78
-
79
-
80
-
81
-
82
-
83
-
84
-
85
-
86
-
87
-
88
-
89
-
90
-
91
-
92
-
93
-
94
-
95
-
96
-
 97
97 -
 98
98 -
 99
99 -
 100
100 -
 101
101 -
 102
102 -
 103
103 -
 104
104 -
 105
105 -
 106
106 -
 107
107 -
 108
108 -
 109
109 -
 110
110 -
 111
111 -
 112
112 -
 113
113 -
 114
114 -
 115
115 -
 116
116 -
 117
117 -
118
-
119
-
120
-
121
-
122
-
123
-
124
-
125
-
126
-
127
-
128
-
129
-
130
-
131
-
132
-
133
-
134
-
135
-
136
-
137
-
138
-
139
-
140
-
141
-
142
-
143
-
144
-
145
-
146
-
147
-
148
-
149
-
150
-
151
-
152
-
153
-
154
-
155
-
156
-
157
-
158
-
159
-
160
-
161
-
162
-
163
-
164
-
165
-
166
-
167
-
168
-
169
-
170
-
171
-
172
-
173
-
174
-
175
-
176
-
177
-
178
-
179
-
180
-
181
-
182
-
183
-
184
-
185
-
186
-
187
-
188
-
189
-
190
-
191
-
192
-
193
-
194
-
195
-
196
-
197
-
198
-
199
-
200
-
201
-
202
-
203
-
204
-
205
-
206
-
207
-
208
-
209
-
210
-
211
-
212
-
213
-
214
-
215
-
216
-
217
-
218
-
219
-
220
-
221
-
222
-
223
-
224
-
225
-
226
-
227
-
228
-
229
-
230
-
231
-
232
-
233
-
234
-
235
-
236
-
237
-
238
-
239
-
240
-
241
-
242
-
243
-
244
-
245
-
246
-
247
-
248
-
249
-
250
-
251
-
252
-
253
-
254
-
255
-
256
-
257
-
258
-
259
-
260
-
261
-
262
-
263
-
264
-
265
-
266
-
267
-
268
 |
 |

2Group Management Report – Financial Review
103
2014
/
03.2
/
adidas Group
/
2014 Annual Report
Group Business Performance
/
Economic and Sector Development
Group Business Performance
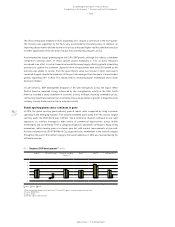
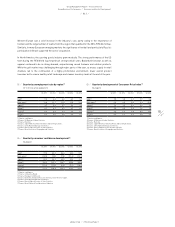
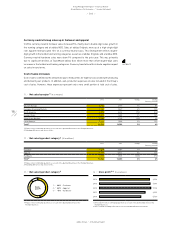
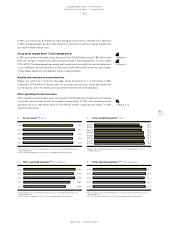
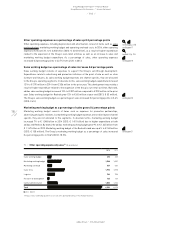
In 2014, adidas Group results were significantly impacted by a challenging golf market,
negative currency effects and a weakening of consumer sentiment in Russia/CIS.
Currency-neutral sales for the Group’s continuing operations increased 6% as a result
of strong growth in Wholesale and Retail. In euro terms, adidas Group revenues grew
2% to € 14.534 billion from € 14.203 billion in 2013. The Group’s gross margin decreased
1.7 percentage points to 47.6% (2013: 49.3%), mainly due to negative currency effects, higher
input costs, increased clearance activities in Russia/CIS as well as lower product margins
at TaylorMade-adidas Golf. In 2014, the adidas Group incurred goodwill impairment losses
of € 78 million (2013: € 52 million). These one-off expenses were non-cash in nature
and did not affect the adidas Group’s liquidity. Excluding goodwill impairment losses,
the Group’s operating profit from continuing operations declined 22% to € 961 million
compared to € 1.233 billion in 2013, representing an operating margin of 6.6%, down
2.1 percentage points compared to the prior year (2013: 8.7%). This development was
primarily due to the negative effects from the lower gross margin as well as higher other
operating expenses as a percentage of sales. The Group’s net income from continuing
operations, excluding goodwill impairment losses, decreased 22% to € 642 million. In
2014, the adidas Group incurred losses from discontinued operations of € 68 million (2013:
gains from discontinued operations of € 17 million). As a result, net income attributable to
shareholders from continuing and discontinued operations excluding goodwill impairment
losses was down 32% to € 568 million (2013: € 839 million). Basic and diluted earnings per
share from continuing and discontinued operations excluding goodwill impairment losses
decreased 32% to € 2.72 from € 4.01 in 2013.
Economic and Sector Development
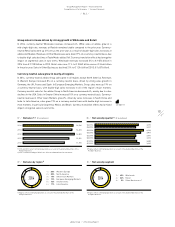
Global economy expands 2.6% in 2014
In 2014, the global economy grew at a lower rate than initially projected, with global gross domestic
product (GDP) modestly strengthening 2.6%. This weaker than expected global recovery mainly
reflects accommodative monetary policies, declining commodity prices and weak international
trade. Growth in major economies was disparate and developing countries recorded disappointing
results, driven by lower external demand, political uncertainties and domestic policy tightening.
GDP in Western Europe grew 1.3% in 2014. While the UK gathered momentum and recorded robust
expansion, the economies in the euro area grew only slightly after two years of recession. Most of
the region’s economies were characterised by low inflationary pressures, relatively robust export
activity and stable consumer spending. At the same time, high unemployment levels and lacklustre
investment spending played a major role in the stuttering recovery.
European emerging markets recorded GDP growth of 2.3%. The deceleration from previous years
was mainly the result of political unrest in Russia/Ukraine, sanctions and high inflationary pressures
which resulted in lower consumer and investment spending. The further weakening of the rouble
together with the continuous decline in oil prices put additional constraints on Russia’s growth.