Reebok 2014 Annual Report Download - page 42
Download and view the complete annual report
Please find page 42 of the 2014 Reebok annual report below. You can navigate through the pages in the report by either clicking on the pages listed below, or by using the keyword search tool below to find specific information within the annual report.-
 1
1 -
2
-
3
-
4
-
5
-
6
-
7
-
8
-
9
-
10
-
11
-
12
-
13
-
14
-
15
-
16
-
17
-
18
-
19
-
20
-
21
-
22
-
23
-
24
-
25
-
26
-
27
-
28
-
29
-
30
-
31
-
 32
32 -
 33
33 -
 34
34 -
 35
35 -
 36
36 -
 37
37 -
 38
38 -
 39
39 -
 40
40 -
 41
41 -
 42
42 -
 43
43 -
 44
44 -
 45
45 -
 46
46 -
 47
47 -
 48
48 -
 49
49 -
 50
50 -
 51
51 -
 52
52 -
53
-
54
-
55
-
56
-
57
-
58
-
59
-
60
-
61
-
62
-
63
-
64
-
65
-
66
-
67
-
68
-
69
-
70
-
71
-
72
-
73
-
74
-
75
-
76
-
77
-
78
-
79
-
80
-
81
-
82
-
83
-
84
-
85
-
86
-
87
-
88
-
89
-
90
-
91
-
92
-
93
-
94
-
95
-
96
-
97
-
98
-
99
-
100
-
101
-
102
-
103
-
104
-
105
-
106
-
107
-
108
-
109
-
110
-
111
-
112
-
113
-
114
-
115
-
116
-
117
-
118
-
119
-
120
-
121
-
122
-
123
-
124
-
125
-
126
-
127
-
128
-
129
-
130
-
131
-
132
-
133
-
134
-
135
-
136
-
137
-
138
-
139
-
140
-
141
-
142
-
143
-
144
-
145
-
146
-
147
-
148
-
149
-
150
-
151
-
152
-
153
-
154
-
155
-
156
-
157
-
158
-
159
-
160
-
161
-
162
-
163
-
164
-
165
-
166
-
167
-
168
-
169
-
170
-
171
-
172
-
173
-
174
-
175
-
176
-
177
-
178
-
179
-
180
-
181
-
182
-
183
-
184
-
185
-
186
-
187
-
188
-
189
-
190
-
191
-
192
-
193
-
194
-
195
-
196
-
197
-
198
-
199
-
200
-
201
-
202
-
203
-
204
-
205
-
206
-
207
-
208
-
209
-
210
-
211
-
212
-
213
-
214
-
215
-
216
-
217
-
218
-
219
-
220
-
221
-
222
-
223
-
224
-
225
-
226
-
227
-
228
-
229
-
230
-
231
-
232
-
233
-
234
-
235
-
236
-
237
-
238
-
239
-
240
-
241
-
242
-
243
-
244
-
245
-
246
-
247
-
248
-
249
-
250
-
251
-
252
-
253
-
254
-
255
-
256
-
257
-
258
-
259
-
260
-
261
-
262
-
263
-
264
-
265
-
266
-
267
-
268
 |
 |

7
38
2014
/
01.7
/
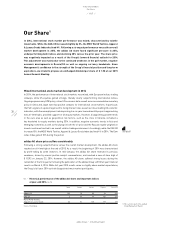
Our Share
To Our Shareholders
adidas Group
/
2014 Annual Report
Our Share
In 2014, international stock market performance was mixed, characterised by volatile
movements. While the DAX-30 increased slightly by 3%, the MSCI World Textiles, Apparel
& Luxury Goods Index declined 4%. Following a strong outperformance versus the overall
market development in 2013, the adidas AG share faced significant pressure in 2014,
underperforming both indices and declining 38% versus the prior year. The share price
was negatively impacted as a result of the Group’s lowered financial outlook for 2014.
This adjustment was mainly due to the continued weakness in the golf market, negative
economic developments in Russia/CIS as well as ongoing currency headwinds. Given
Management’s confidence in the strength of the Group’s financial position and long-term
aspirations, we intend to propose an unchanged dividend per share of € 1.50 at our 2015
Annual General Meeting.
Mixed international stock market development in 2014
In 2014, the performance of international stock markets was mixed, with European indices trading
sideways, while US equities gained strongly, thereby clearly outperforming international indices.
Ongoing expansionary ECB policy, robust US economic data as well as an accommodative monetary
policy in China and Japan were key positive catalysts for international stock markets. In particular,
the Fed’s signals of a patient approach to rising interest rates as well as robust leading US economic
indicators, with the unemployment rate improving to a six-year low and monthly exports approaching
new all-time highs, provided support for US equity markets. However, disappointing growth trends
in the euro area as well as geopolitical risk factors, such as the crisis in Ukraine, remained a
key headwind for equity markets during 2014. In addition, negative economic trends in Asia and
emerging economies as well as the plunge in both the oil price and the Russian rouble weighed on
investor sentiment and led to an overall volatile trading environment. Accordingly, while the DAX-30
increased 3%, the MSCI World Textiles, Apparel & Luxury Goods Index declined 4% in 2014. The Dow
Jones Index gained 10% during the period.
adidas AG share price suffers considerably
Following a strong outperformance versus the overall market development, the adidas AG share
reached an all-time high at the end of 2013. As a result, the beginning of 2014 was characterised
by profit-taking by some investors. In mid-January, the adidas AG share reversed its previous
weakness, driven by several positive analyst commentaries, and reached a new all-time high of
€ 92.92 on January 22, 2014. However, the adidas AG share suffered strong losses during the
remainder of the first quarter following the publication of the adidas Group’s 2013 full year financial
results on March 5, 2014. While full year 2013 results came in slightly above market expectations,
the Group’s full year 2014 outlook disappointed most market participants.
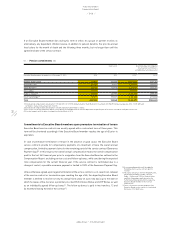
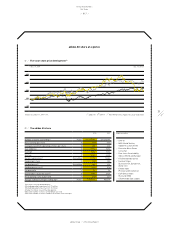
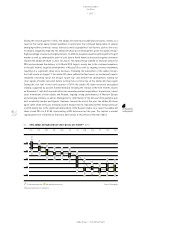
see Table 01
01
/
Historical performance of the adidas AG share and important indices
at year-end 2014 (in %)
1 year 3 years 5 years 10 years Since IPO
adidas AG (38) 15 53 94 496
DAX-30 3 66 65 130 346
MSCI World Textiles,
Apparel & Luxury Goods (4) 51 108 177 397
Source: Bloomberg. 1) This section is part of the audited
Group Management Report.
1)