Reebok 2014 Annual Report Download - page 116
Download and view the complete annual report
Please find page 116 of the 2014 Reebok annual report below. You can navigate through the pages in the report by either clicking on the pages listed below, or by using the keyword search tool below to find specific information within the annual report.-
 1
1 -
2
-
3
-
4
-
5
-
6
-
7
-
8
-
9
-
10
-
11
-
12
-
13
-
14
-
15
-
16
-
17
-
18
-
19
-
20
-
21
-
22
-
23
-
24
-
25
-
26
-
27
-
28
-
29
-
30
-
31
-
32
-
33
-
34
-
35
-
36
-
37
-
38
-
39
-
40
-
41
-
42
-
43
-
44
-
45
-
46
-
47
-
48
-
49
-
50
-
51
-
52
-
53
-
54
-
55
-
56
-
57
-
58
-
59
-
60
-
61
-
62
-
63
-
64
-
65
-
66
-
67
-
68
-
69
-
70
-
71
-
72
-
73
-
74
-
75
-
76
-
77
-
78
-
79
-
80
-
81
-
82
-
83
-
84
-
85
-
86
-
87
-
88
-
89
-
90
-
91
-
92
-
93
-
94
-
95
-
96
-
97
-
98
-
99
-
100
-
101
-
102
-
103
-
104
-
105
-
 106
106 -
 107
107 -
 108
108 -
 109
109 -
 110
110 -
 111
111 -
 112
112 -
 113
113 -
 114
114 -
 115
115 -
 116
116 -
 117
117 -
 118
118 -
 119
119 -
 120
120 -
 121
121 -
 122
122 -
 123
123 -
 124
124 -
 125
125 -
 126
126 -
127
-
128
-
129
-
130
-
131
-
132
-
133
-
134
-
135
-
136
-
137
-
138
-
139
-
140
-
141
-
142
-
143
-
144
-
145
-
146
-
147
-
148
-
149
-
150
-
151
-
152
-
153
-
154
-
155
-
156
-
157
-
158
-
159
-
160
-
161
-
162
-
163
-
164
-
165
-
166
-
167
-
168
-
169
-
170
-
171
-
172
-
173
-
174
-
175
-
176
-
177
-
178
-
179
-
180
-
181
-
182
-
183
-
184
-
185
-
186
-
187
-
188
-
189
-
190
-
191
-
192
-
193
-
194
-
195
-
196
-
197
-
198
-
199
-
200
-
201
-
202
-
203
-
204
-
205
-
206
-
207
-
208
-
209
-
210
-
211
-
212
-
213
-
214
-
215
-
216
-
217
-
218
-
219
-
220
-
221
-
222
-
223
-
224
-
225
-
226
-
227
-
228
-
229
-
230
-
231
-
232
-
233
-
234
-
235
-
236
-
237
-
238
-
239
-
240
-
241
-
242
-
243
-
244
-
245
-
246
-
247
-
248
-
249
-
250
-
251
-
252
-
253
-
254
-
255
-
256
-
257
-
258
-
259
-
260
-
261
-
262
-
263
-
264
-
265
-
266
-
267
-
268
 |
 |
112
2014
/
03.2
/
adidas Group
/
2014 Annual Report
Group Management Report – Financial Review
Group Business Performance
/
Income Statement
Goodwill impairment in an amount of € 78 million
As a result of the annual impairment test, the adidas Group has impaired goodwill and recorded a
€ 78 million pre-tax charge as at December 31, 2014 (2013: € 52 million). This charge was related to
the Retail cash-generating unit Russia/CIS. As a result, the goodwill of this cash-generating unit is
completely impaired. The impairment losses were mainly caused by adjusted growth assumptions
due to the significant deterioration of the Russian rouble. In 2013, goodwill impairment losses of
€ 23 million were recognised within the Wholesale cash-generating unit Iberia. Within the Retail
cash-generating unit North America, goodwill impairment losses of € 29 million were recognised in
2013. Both impairment losses were mainly caused by adjusted growth assumptions and an increase
in the country-specific discount rates. The impairment losses in both years were non-cash in nature
and do not affect the adidas Group’s liquidity.
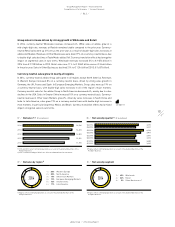
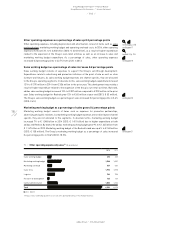
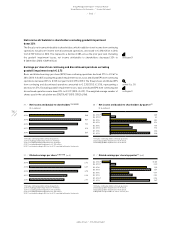
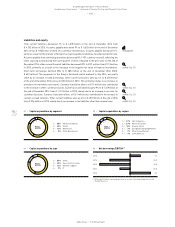
Operating margin excluding goodwill impairment declines to 6.6%
Group operating profit declined 25% to € 883 million in 2014 versus € 1.181 billion in 2013. The
operating margin of the adidas Group decreased 2.2 percentage points to 6.1% (2013: 8.3%).
Excluding the goodwill impairment losses, operating profit was down 22% to € 961 million from
€ 1.233 billion last year, representing an operating margin of 6.6%, down 2.1 percentage points
(2013: 8.7%). This development was primarily due to the negative effects from the lower gross
margin as well as higher other operating expenses as a percentage of sales.
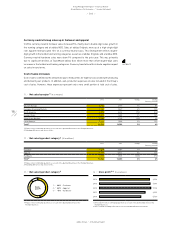
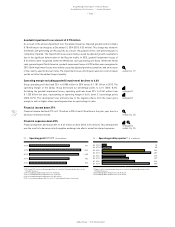
Financial income down 27%
Financial income declined 27% to € 19 million in 2014 from € 26 million in the prior year, due to a
decrease in interest income.
Financial expenses down 28%
Financial expenses decreased 28% to € 67 million in 2014 (2013: € 94 million). This development
was the result of a decrease in both negative exchange rate effects as well as interest expenses.
see Note 02, p. 197
see Diagram 23
see Diagram 25
see Note 33, p. 235
see Diagram 26
see Note 33, p. 235
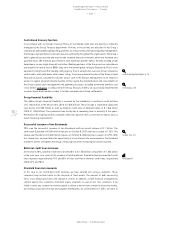
23
/
Operating profit 1) 2) 3) 4) 5) (€ in millions)
2014 961
2013 1,233
2012 1,185
2011 953
2010 894
1) 2014 and 2013 reflect continuing operations as a result of the planned divestiture of the
Rockport business.
2) 2014 exluding goodwill impairment of € 78 million.
3) 2013 excluding goodwill impairment of € 52 million.
4) 2012 excluding goodwill impairment of € 265 million.
5) 2011 restated according to IAS 8 in the 2012 consolidated financial statements.
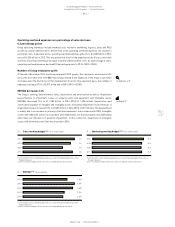
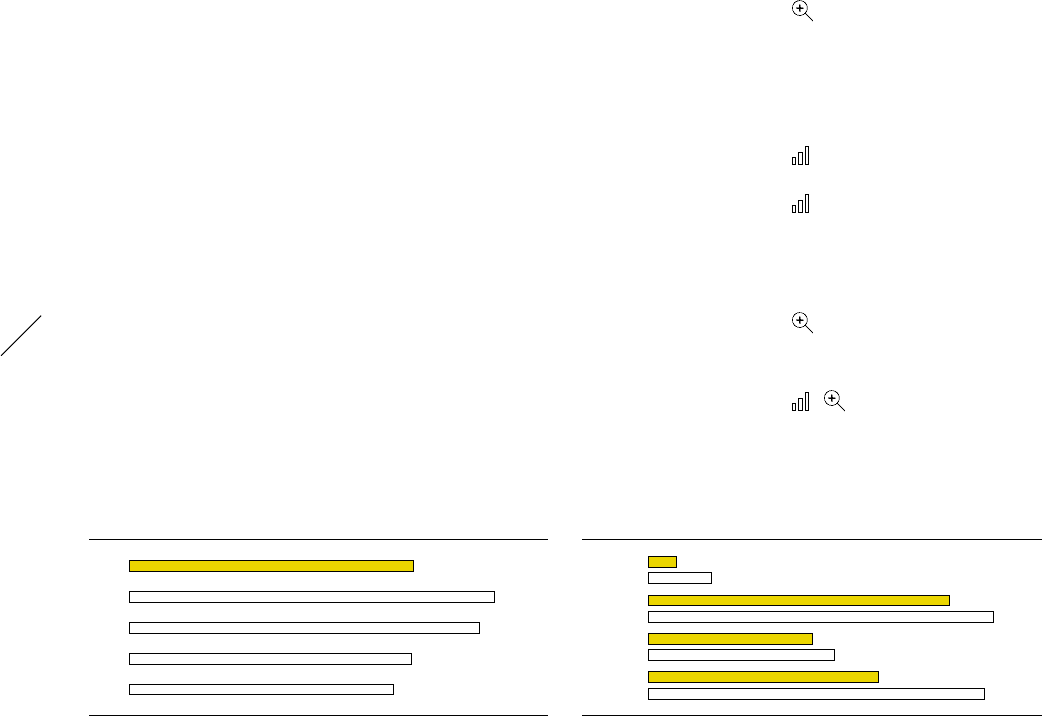
24
/
Operating profit by quarter 1) (€ in millions)
Q4 2014 2) 38
Q4 2013 3) 85
Q3 2014 399
Q3 2013 457
Q2 2014 218
Q2 2013 247
Q1 2014 306
Q1 2013 445
1) Figures reflect continuing operations as a result of the planned divestiture of the
Rockport business.
2) Excluding goodwill impairment of € 78 million.
3) Excluding goodwill impairment of € 52 million.