Reebok 2014 Annual Report Download - page 104
Download and view the complete annual report
Please find page 104 of the 2014 Reebok annual report below. You can navigate through the pages in the report by either clicking on the pages listed below, or by using the keyword search tool below to find specific information within the annual report.-
 1
1 -
2
-
3
-
4
-
5
-
6
-
7
-
8
-
9
-
10
-
11
-
12
-
13
-
14
-
15
-
16
-
17
-
18
-
19
-
20
-
21
-
22
-
23
-
24
-
25
-
26
-
27
-
28
-
29
-
30
-
31
-
32
-
33
-
34
-
35
-
36
-
37
-
38
-
39
-
40
-
41
-
42
-
43
-
44
-
45
-
46
-
47
-
48
-
49
-
50
-
51
-
52
-
53
-
54
-
55
-
56
-
57
-
58
-
59
-
60
-
61
-
62
-
63
-
64
-
65
-
66
-
67
-
68
-
69
-
70
-
71
-
72
-
73
-
74
-
75
-
76
-
77
-
78
-
79
-
80
-
81
-
82
-
83
-
84
-
85
-
86
-
87
-
88
-
89
-
90
-
91
-
92
-
93
-
 94
94 -
 95
95 -
 96
96 -
 97
97 -
 98
98 -
 99
99 -
 100
100 -
 101
101 -
 102
102 -
 103
103 -
 104
104 -
 105
105 -
 106
106 -
 107
107 -
 108
108 -
 109
109 -
 110
110 -
 111
111 -
 112
112 -
 113
113 -
 114
114 -
115
-
116
-
117
-
118
-
119
-
120
-
121
-
122
-
123
-
124
-
125
-
126
-
127
-
128
-
129
-
130
-
131
-
132
-
133
-
134
-
135
-
136
-
137
-
138
-
139
-
140
-
141
-
142
-
143
-
144
-
145
-
146
-
147
-
148
-
149
-
150
-
151
-
152
-
153
-
154
-
155
-
156
-
157
-
158
-
159
-
160
-
161
-
162
-
163
-
164
-
165
-
166
-
167
-
168
-
169
-
170
-
171
-
172
-
173
-
174
-
175
-
176
-
177
-
178
-
179
-
180
-
181
-
182
-
183
-
184
-
185
-
186
-
187
-
188
-
189
-
190
-
191
-
192
-
193
-
194
-
195
-
196
-
197
-
198
-
199
-
200
-
201
-
202
-
203
-
204
-
205
-
206
-
207
-
208
-
209
-
210
-
211
-
212
-
213
-
214
-
215
-
216
-
217
-
218
-
219
-
220
-
221
-
222
-
223
-
224
-
225
-
226
-
227
-
228
-
229
-
230
-
231
-
232
-
233
-
234
-
235
-
236
-
237
-
238
-
239
-
240
-
241
-
242
-
243
-
244
-
245
-
246
-
247
-
248
-
249
-
250
-
251
-
252
-
253
-
254
-
255
-
256
-
257
-
258
-
259
-
260
-
261
-
262
-
263
-
264
-
265
-
266
-
267
-
268
 |
 |
100
2014
Internal Group Management System
/
03.1
/
adidas Group
/
2014 Annual Report
Group Management Report – Financial Review
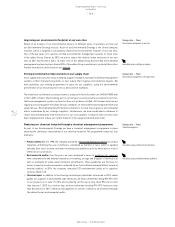
Capital expenditure targeted to maximise future returns
Improving the effectiveness of the Group’s capital expenditure is another lever to maximise our
operating cash flow. We control capital expenditure with a top-down, bottom-up approach. In a first
step, Group management defines focus areas and an overall investment budget based on investment
requests from various functions within the organisation. Our operating segments then align their
initiatives within the scope of assigned priorities and available budget. We evaluate potential return
on planned investments utilising the net present value method. Risk is accounted for, adding a risk
premium to the cost of capital and thus reducing our estimated future earnings streams where
appropriate. By means of scenario planning, the sensitivity of investment returns is tested against
changes in initial assumptions. For large investment projects, timelines and deviations versus
budget are monitored on a monthly basis throughout the course of the project.
The final step of optimising return on investments is our selective post-mortem reviews, where
larger projects in particular are evaluated and learnings are documented to be available for future
capital expenditure decisions.
Non-financial key performance indicators
In addition to the Group’s major financial KPIs to assess the current performance and operational
success of the adidas Group, as outlined above, we have identified a set of non-financial KPIs that
help us track our progress in areas that are critical for our long-term success but are, however, not
directly reflected in the Group’s financial statements. These non-financial KPIs are assessed on a
regular basis and managed by the respective Group functions. Non-financial KPIs include market
share and consumer insight tracking, our customer delivery performance (On-Time In-Full), our
employee engagement and a set of KPIs in the area of our sustainability performance.
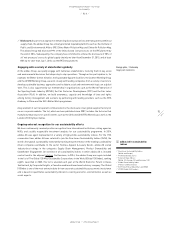
Market share: Maintaining and enhancing brand image and reputation through the creation of strong
brand identities is crucial for sustaining and driving revenue and profit growth. It is also an important
credential as we extend our brands into new categories and regions. Therefore, mainly on a market
and category level, we invest in primary qualitative and quantitative research such as trend scouting,
consumer surveys and market share data to determine brand and category strength. Measures
that are regularly tracked include market shares, brand awareness, likeability and purchase intent.
These efforts are supported by global market research and consumer insight teams.
adidas Group financial KPIs
/
Capital expenditure
see Management Assessment of Performance,
Risks and Opportunities, and Outlook, p. 181
02
/
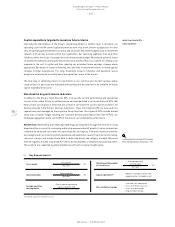
Key financial metrics
1) Excluding acquisitions and finance leases.
Gross margin Gross profit
= × 100
Net sales
Operating margin Operating profit
= × 100
Net sales
Average operating
working capital
Sum of operating working
capital at quarter-end
=
4
Net cash/Net borrowings =
Cash and cash equivalents
+ short-term financial assets
– short-term borrowings
– long-term borrowings
Operating working capital
in % of net sales
Average operating
working capital
= × 100
Net sales
Capital expenditure 1) = Additions of property, plant and
equipment plus intangible assets