Reebok 2014 Annual Report Download - page 91
Download and view the complete annual report
Please find page 91 of the 2014 Reebok annual report below. You can navigate through the pages in the report by either clicking on the pages listed below, or by using the keyword search tool below to find specific information within the annual report.-
 1
1 -
2
-
3
-
4
-
5
-
6
-
7
-
8
-
9
-
10
-
11
-
12
-
13
-
14
-
15
-
16
-
17
-
18
-
19
-
20
-
21
-
22
-
23
-
24
-
25
-
26
-
27
-
28
-
29
-
30
-
31
-
32
-
33
-
34
-
35
-
36
-
37
-
38
-
39
-
40
-
41
-
42
-
43
-
44
-
45
-
46
-
47
-
48
-
49
-
50
-
51
-
52
-
53
-
54
-
55
-
56
-
57
-
58
-
59
-
60
-
61
-
62
-
63
-
64
-
65
-
66
-
67
-
68
-
69
-
70
-
71
-
72
-
73
-
74
-
75
-
76
-
77
-
78
-
79
-
80
-
 81
81 -
 82
82 -
 83
83 -
 84
84 -
 85
85 -
 86
86 -
 87
87 -
 88
88 -
 89
89 -
 90
90 -
 91
91 -
 92
92 -
 93
93 -
 94
94 -
 95
95 -
 96
96 -
 97
97 -
 98
98 -
 99
99 -
 100
100 -
 101
101 -
102
-
103
-
104
-
105
-
106
-
107
-
108
-
109
-
110
-
111
-
112
-
113
-
114
-
115
-
116
-
117
-
118
-
119
-
120
-
121
-
122
-
123
-
124
-
125
-
126
-
127
-
128
-
129
-
130
-
131
-
132
-
133
-
134
-
135
-
136
-
137
-
138
-
139
-
140
-
141
-
142
-
143
-
144
-
145
-
146
-
147
-
148
-
149
-
150
-
151
-
152
-
153
-
154
-
155
-
156
-
157
-
158
-
159
-
160
-
161
-
162
-
163
-
164
-
165
-
166
-
167
-
168
-
169
-
170
-
171
-
172
-
173
-
174
-
175
-
176
-
177
-
178
-
179
-
180
-
181
-
182
-
183
-
184
-
185
-
186
-
187
-
188
-
189
-
190
-
191
-
192
-
193
-
194
-
195
-
196
-
197
-
198
-
199
-
200
-
201
-
202
-
203
-
204
-
205
-
206
-
207
-
208
-
209
-
210
-
211
-
212
-
213
-
214
-
215
-
216
-
217
-
218
-
219
-
220
-
221
-
222
-
223
-
224
-
225
-
226
-
227
-
228
-
229
-
230
-
231
-
232
-
233
-
234
-
235
-
236
-
237
-
238
-
239
-
240
-
241
-
242
-
243
-
244
-
245
-
246
-
247
-
248
-
249
-
250
-
251
-
252
-
253
-
254
-
255
-
256
-
257
-
258
-
259
-
260
-
261
-
262
-
263
-
264
-
265
-
266
-
267
-
268
 |
 |
adidas Group
/
2014 Annual Report
Group Management Report – Our Group
87
2014
Employees
/
02.7
/
conducted in 2010 and 2013, were stable at a rate comparable to the average engagement level
of our survey provider’s client database. In 2013, improvements were achieved in specific scores
relating to performance management and learning and development opportunities. In 2014, the
adidas Group continued to act on the findings of the second employee engagement survey as well
as subsequent follow-up analysis. Globally coordinated Results to Action teams (R2A) have been
formed across all departments in order to address our employees’ feedback. We aim to improve
the overall engagement score in our next employee engagement survey, which will be conducted
in 2016.
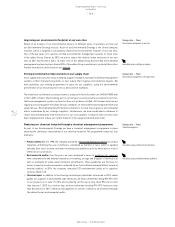
Employer of choice: Our ‘employer of choice’ status continues to garner worldwide recognition and
enables us to attract, retain and engage industry-leading talent to sustain the company’s success
and growth. In 2014, adidas Group locations around the world leveraged our employer brand
attributes for attraction, retention and engagement strategies. In 2014, this work contributed to
driving 4 million visitors to our career site, with 1.5 million job views and over 300,000 applications
worldwide. This work has also enabled us to recruit some of the industry’s top talent.
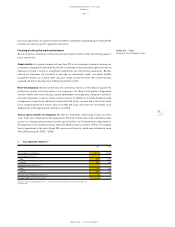
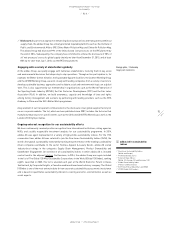
Online platforms to drive employee collaboration and learning
We believe that a robust and state-of-the-art internal communication platform is essential for driving
employee engagement and fostering learning as well as open collaboration within our organisation.
We use an enterprise collaboration platform called ‘a-LIVE’, which brings the intranet, online
collaboration platforms and important system applications under one roof. It allows departments
and teams to quickly build and edit their own internal collaboration and communication platforms
and connects users across departments as well as locations. It encourages employees to share
knowledge, collaborate and discuss current topics. In addition, we have established an ‘Ask the
Management’ platform on our intranet, enabling employees to openly address questions to our
senior leaders which are then answered promptly.
see Diagram 03
Strategic area
/
Capabilities
Internal collaboration and e-learning
04
/
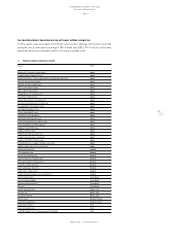
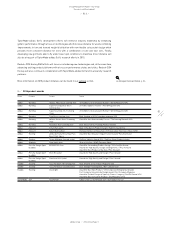
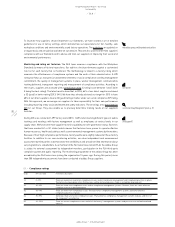
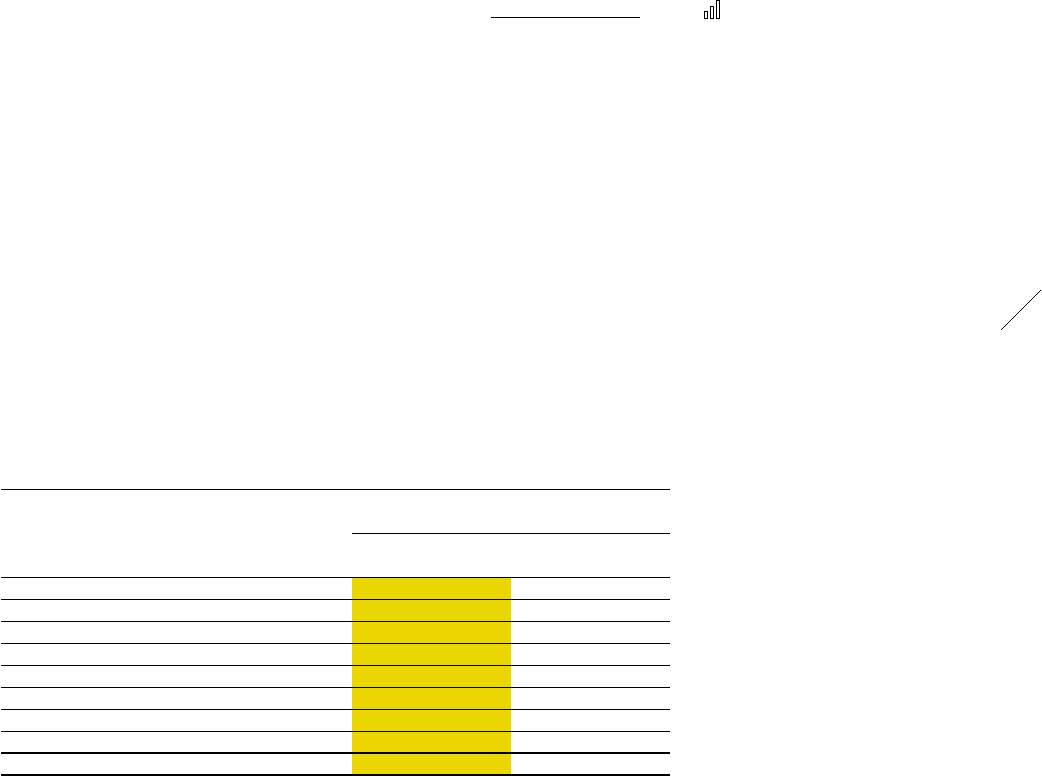
Number of employees by function 1)
2014 2013
Employees 2) Full-time
equivalents 3)
Employees 2) Full-time
equivalents 3)
Own retail 31,803 25,135 27,477 21,694
Sales 3,936 3,815 4,457 4,271
Logistics 6,009 5,545 5,945 5,405
Marketing 3,990 3,841 3,844 3,701
Central functions and administration 4,536 4,282 4,540 4,275
Production 1,360 1,287 1,501 1,437
Research & development 985 924 992 948
IT 1,112 1,088 1,052 1,028
Total 53,731 45,917 49,808 42,758
1) At year-end. Figures reflect continuing operations as a result of the planned divestiture of the Rockport business.
2) Number of employees on a headcount basis.
3) Number of employees on a full-time equivalent basis. Due to the high share of part-time employees in our Retail segment,
this figure is lower than the number of employees counted on a headcount basis.