Reebok 2014 Annual Report Download - page 126
Download and view the complete annual report
Please find page 126 of the 2014 Reebok annual report below. You can navigate through the pages in the report by either clicking on the pages listed below, or by using the keyword search tool below to find specific information within the annual report.-
 1
1 -
2
-
3
-
4
-
5
-
6
-
7
-
8
-
9
-
10
-
11
-
12
-
13
-
14
-
15
-
16
-
17
-
18
-
19
-
20
-
21
-
22
-
23
-
24
-
25
-
26
-
27
-
28
-
29
-
30
-
31
-
32
-
33
-
34
-
35
-
36
-
37
-
38
-
39
-
40
-
41
-
42
-
43
-
44
-
45
-
46
-
47
-
48
-
49
-
50
-
51
-
52
-
53
-
54
-
55
-
56
-
57
-
58
-
59
-
60
-
61
-
62
-
63
-
64
-
65
-
66
-
67
-
68
-
69
-
70
-
71
-
72
-
73
-
74
-
75
-
76
-
77
-
78
-
79
-
80
-
81
-
82
-
83
-
84
-
85
-
86
-
87
-
88
-
89
-
90
-
91
-
92
-
93
-
94
-
95
-
96
-
97
-
98
-
99
-
100
-
101
-
102
-
103
-
104
-
105
-
106
-
107
-
108
-
109
-
110
-
111
-
112
-
113
-
114
-
115
-
 116
116 -
 117
117 -
 118
118 -
 119
119 -
 120
120 -
 121
121 -
 122
122 -
 123
123 -
 124
124 -
 125
125 -
 126
126 -
 127
127 -
 128
128 -
 129
129 -
 130
130 -
 131
131 -
 132
132 -
 133
133 -
 134
134 -
 135
135 -
 136
136 -
137
-
138
-
139
-
140
-
141
-
142
-
143
-
144
-
145
-
146
-
147
-
148
-
149
-
150
-
151
-
152
-
153
-
154
-
155
-
156
-
157
-
158
-
159
-
160
-
161
-
162
-
163
-
164
-
165
-
166
-
167
-
168
-
169
-
170
-
171
-
172
-
173
-
174
-
175
-
176
-
177
-
178
-
179
-
180
-
181
-
182
-
183
-
184
-
185
-
186
-
187
-
188
-
189
-
190
-
191
-
192
-
193
-
194
-
195
-
196
-
197
-
198
-
199
-
200
-
201
-
202
-
203
-
204
-
205
-
206
-
207
-
208
-
209
-
210
-
211
-
212
-
213
-
214
-
215
-
216
-
217
-
218
-
219
-
220
-
221
-
222
-
223
-
224
-
225
-
226
-
227
-
228
-
229
-
230
-
231
-
232
-
233
-
234
-
235
-
236
-
237
-
238
-
239
-
240
-
241
-
242
-
243
-
244
-
245
-
246
-
247
-
248
-
249
-
250
-
251
-
252
-
253
-
254
-
255
-
256
-
257
-
258
-
259
-
260
-
261
-
262
-
263
-
264
-
265
-
266
-
267
-
268
 |
 |

122
2014
/
03.2
/
adidas Group
/
2014 Annual Report
Group Management Report – Financial Review
Group Business Performance
/
Treasury
Centralised treasury function
In accordance with our Group’s Treasury Policy, all worldwide credit lines are directly or indirectly
managed by the Group Treasury department. Portions of those lines are allocated to the Group’s
subsidiaries and backed by adidas AG guarantees. As a result of this centralised liquidity management,
the Group is well positioned to allocate resources efficiently throughout the organisation. The Group’s
debt is generally unsecured and may include standard financial covenants, which are reviewed on a
quarterly basis. We maintain good relations with numerous partner banks, thereby avoiding a high
dependency on any single financial institution. Banking partners of the Group and our subsidiaries
are required to have at least a BBB+ long-term investment grade rating by Standard & Poor’s or an
equivalent rating by another leading rating agency. Only in exceptional cases are Group companies
authorised to work with banks with a lower rating. To ensure optimal allocation of the Group’s liquid
financial resources, subsidiaries transfer excess cash to the Group’s headquarters in all instances
where it is legally and economically feasible. In this regard, the standardisation and consolidation of
the Group’s global cash management and payment processes, including automated domestic and
cross-border cash pools, is a key priority for Group Treasury. In 2014, we successfully implemented
a new in-house bank module in order to further automate intra-Group settlements.
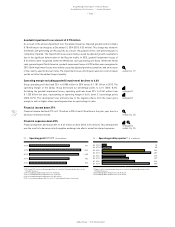
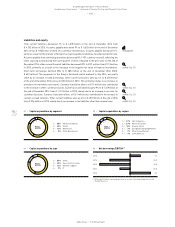
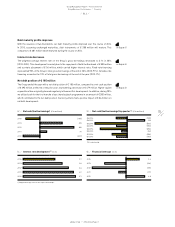
Group financial flexibility
The adidas Group’s financial flexibility is ensured by the availability of unutilised credit facilities
of € 1.846 billion at the end of 2014 (2013: € 2.026 billion). These include a committed syndicated
loan facility of € 500 million as well as bilateral credit lines at different banks of € 1.346 billion
(2013: € 1.526 billion). The syndicated loan facility has a remaining time to maturity of five years.
We monitor the ongoing need for available credit lines based on the current level of debt as well as
future financing requirements.
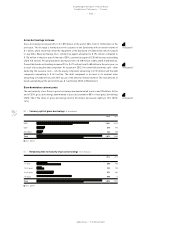
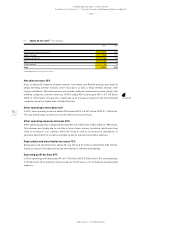
Successful issuance of two Eurobonds
2014 saw the successful issuance of two Eurobonds with an overall volume of € 1 billion. The
seven-year Eurobond of € 600 million matures on October 8, 2021 and has a coupon of 1.25%. The
twelve-year Eurobond of € 400 million matures on October 8, 2026 and has a coupon of 2.25%. With
this transaction, we have taken the opportunity of a low interest rate environment in the Eurobond
market to further strengthen the Group’s financing mix while increasing the overall duration.
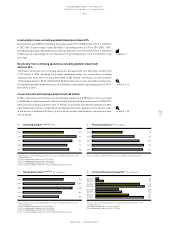
Bilateral credit lines decrease
At the end of 2014, bilateral credit lines declined 8% to € 1.520 billion compared to € 1.652 billion
in the prior year, as a result of the issuance of two Eurobonds. Committed and uncommitted credit
lines represent approximately 15% and 85% of total short-term bilateral credit lines, respectively
(2013: 22% and 78%).
Standard financial covenants
In the case of our committed credit facilities, we have entered into various covenants. These
covenants may include limits on the disposal of fixed assets, the amount of debt secured by
liens, cross default provisions and change of control. In addition, certain financial arrangements
contain equity ratio covenants, minimum equity covenants as well as net loss covenants. If we
failed to meet any covenant and were unable to obtain a waiver from a majority of partner banks,
borrowings would become due and payable immediately. As at December 31, 2014, we were in
see Risk and Opportunity Report, p. 154
see Glossary, p. 258
see Note 18, p. 213
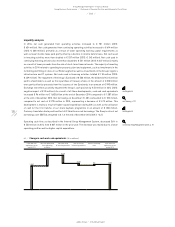
see Diagram 49