Reebok 2014 Annual Report Download - page 3
Download and view the complete annual report
Please find page 3 of the 2014 Reebok annual report below. You can navigate through the pages in the report by either clicking on the pages listed below, or by using the keyword search tool below to find specific information within the annual report.-
 1
1 -
 2
2 -
 3
3 -
 4
4 -
 5
5 -
 6
6 -
 7
7 -
 8
8 -
 9
9 -
 10
10 -
 11
11 -
 12
12 -
 13
13 -
 14
14 -
15
-
16
-
17
-
18
-
19
-
20
-
21
-
22
-
23
-
24
-
25
-
26
-
27
-
28
-
29
-
30
-
31
-
32
-
33
-
34
-
35
-
36
-
37
-
38
-
39
-
40
-
41
-
42
-
43
-
44
-
45
-
46
-
47
-
48
-
49
-
50
-
51
-
52
-
53
-
54
-
55
-
56
-
57
-
58
-
59
-
60
-
61
-
62
-
63
-
64
-
65
-
66
-
67
-
68
-
69
-
70
-
71
-
72
-
73
-
74
-
75
-
76
-
77
-
78
-
79
-
80
-
81
-
82
-
83
-
84
-
85
-
86
-
87
-
88
-
89
-
90
-
91
-
92
-
93
-
94
-
95
-
96
-
97
-
98
-
99
-
100
-
101
-
102
-
103
-
104
-
105
-
106
-
107
-
108
-
109
-
110
-
111
-
112
-
113
-
114
-
115
-
116
-
117
-
118
-
119
-
120
-
121
-
122
-
123
-
124
-
125
-
126
-
127
-
128
-
129
-
130
-
131
-
132
-
133
-
134
-
135
-
136
-
137
-
138
-
139
-
140
-
141
-
142
-
143
-
144
-
145
-
146
-
147
-
148
-
149
-
150
-
151
-
152
-
153
-
154
-
155
-
156
-
157
-
158
-
159
-
160
-
161
-
162
-
163
-
164
-
165
-
166
-
167
-
168
-
169
-
170
-
171
-
172
-
173
-
174
-
175
-
176
-
177
-
178
-
179
-
180
-
181
-
182
-
183
-
184
-
185
-
186
-
187
-
188
-
189
-
190
-
191
-
192
-
193
-
194
-
195
-
196
-
197
-
198
-
199
-
200
-
201
-
202
-
203
-
204
-
205
-
206
-
207
-
208
-
209
-
210
-
211
-
212
-
213
-
214
-
215
-
216
-
217
-
218
-
219
-
220
-
221
-
222
-
223
-
224
-
225
-
226
-
227
-
228
-
229
-
230
-
231
-
232
-
233
-
234
-
235
-
236
-
237
-
238
-
239
-
240
-
241
-
242
-
243
-
244
-
245
-
246
-
247
-
248
-
249
-
250
-
251
-
252
-
253
-
254
-
255
-
256
-
257
-
258
-
259
-
260
-
261
-
262
-
263
-
264
-
265
-
266
-
267
-
268
 |
 |
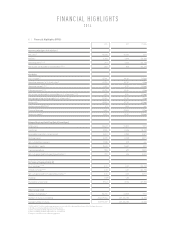
FINANCIAL HIGHLIGHTS
2014
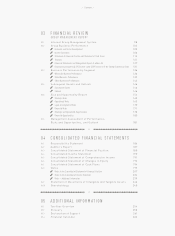
01 / Financial Highlights (IFRS)
2014 2013 Change
Operating Highlights (€ in millions)
Net sales 1) 14,534 14,203 2.3%
EBITDA 1) 1,283 1,496 (14.3%)
Operating profi t 1) 3) 4) 961 1,233 (22.1%)
Net income attributable to shareholders 2) 3) 4) 568 839 (32.2%)
Key Ratios
Gross margin 1) 47.6% 49.3% (1.7pp)
Operating expenses in % of net sales 1) 42.7% 42.3% 0.3pp
Operating margin 1) 3) 4) 6.6% 8.7% (2.1pp)
Effective tax rate 1) 3) 4) 29.7% 29.2% 0.5pp
Net income attributable to shareholders in % of net sales 2) 3) 4) 3.9% 5.9% (2.0pp)
Average operating working capital in % of net sales 1) 22.4% 21.3% 1.0pp
Equity ratio 45.3% 47.3% (2.0pp)
Net borrowings/EBITDA 1) 0.1 (0.2) n.a.
Financial leverage 3.3% (5.4%) 8.7pp
Return on equity 2) 8.7% 14.3% (5.6pp)
Balance Sheet and Cash Flow Data (€ in millions)
Total assets 12,417 11,599 7.1%
Inventories 2,526 2,634 (4.1%)
Receivables and other current assets 2,861 2,583 10.8%
Working capital 2,970 2,125 39.7%
Net cash/(net borrowings) (185) 295 n.a.
Shareholders’ equity 5,624 5,489 2.5%
Capital expenditure 554 479 15.5%
Net cash generated from operating activities 2) 701 634 10.5%
Per Share of Common Stock (€)
Basic earnings 2) 3) 4) 2.72 4.01 (32.1%)
Diluted earnings 2) 3) 4) 2.72 4.01 (32.1%)
Net cash generated from operating activities 2) 3.36 3.03 10.7%
Dividend 1.50 5) 1.50 –
Share price at year-end 57.62 92.64 (37.8%)
Other (at year-end)
Number of employees 1) 53,731 49,808 7.9%
Number of shares outstanding 204,327,044 209,216,186 (2.3%)
Average number of shares 208,776,457 209,216,186 (0.2%)
1) 2014 and 2013 refl ect continuing operations as a result of the planned divestiture of the Rockport business.
2) Includes continuing and discontinued operations.
3) 2014 excluding goodwill impairment of € 78 million.
4) 2013 excluding goodwill impairment of € 52 million.
5) Subject to Annual General Meeting approval.