Reebok 2014 Annual Report Download - page 160
Download and view the complete annual report
Please find page 160 of the 2014 Reebok annual report below. You can navigate through the pages in the report by either clicking on the pages listed below, or by using the keyword search tool below to find specific information within the annual report.-
 1
1 -
2
-
3
-
4
-
5
-
6
-
7
-
8
-
9
-
10
-
11
-
12
-
13
-
14
-
15
-
16
-
17
-
18
-
19
-
20
-
21
-
22
-
23
-
24
-
25
-
26
-
27
-
28
-
29
-
30
-
31
-
32
-
33
-
34
-
35
-
36
-
37
-
38
-
39
-
40
-
41
-
42
-
43
-
44
-
45
-
46
-
47
-
48
-
49
-
50
-
51
-
52
-
53
-
54
-
55
-
56
-
57
-
58
-
59
-
60
-
61
-
62
-
63
-
64
-
65
-
66
-
67
-
68
-
69
-
70
-
71
-
72
-
73
-
74
-
75
-
76
-
77
-
78
-
79
-
80
-
81
-
82
-
83
-
84
-
85
-
86
-
87
-
88
-
89
-
90
-
91
-
92
-
93
-
94
-
95
-
96
-
97
-
98
-
99
-
100
-
101
-
102
-
103
-
104
-
105
-
106
-
107
-
108
-
109
-
110
-
111
-
112
-
113
-
114
-
115
-
116
-
117
-
118
-
119
-
120
-
121
-
122
-
123
-
124
-
125
-
126
-
127
-
128
-
129
-
130
-
131
-
132
-
133
-
134
-
135
-
136
-
137
-
138
-
139
-
140
-
141
-
142
-
143
-
144
-
145
-
146
-
147
-
148
-
149
-
 150
150 -
 151
151 -
 152
152 -
 153
153 -
 154
154 -
 155
155 -
 156
156 -
 157
157 -
 158
158 -
 159
159 -
 160
160 -
 161
161 -
 162
162 -
 163
163 -
 164
164 -
 165
165 -
 166
166 -
 167
167 -
 168
168 -
 169
169 -
 170
170 -
171
-
172
-
173
-
174
-
175
-
176
-
177
-
178
-
179
-
180
-
181
-
182
-
183
-
184
-
185
-
186
-
187
-
188
-
189
-
190
-
191
-
192
-
193
-
194
-
195
-
196
-
197
-
198
-
199
-
200
-
201
-
202
-
203
-
204
-
205
-
206
-
207
-
208
-
209
-
210
-
211
-
212
-
213
-
214
-
215
-
216
-
217
-
218
-
219
-
220
-
221
-
222
-
223
-
224
-
225
-
226
-
227
-
228
-
229
-
230
-
231
-
232
-
233
-
234
-
235
-
236
-
237
-
238
-
239
-
240
-
241
-
242
-
243
-
244
-
245
-
246
-
247
-
248
-
249
-
250
-
251
-
252
-
253
-
254
-
255
-
256
-
257
-
258
-
259
-
260
-
261
-
262
-
263
-
264
-
265
-
266
-
267
-
268
 |
 |

156
2014
Risk and Opportunity Report
/
03.5
/
adidas Group
/
2014 Annual Report
Group Management Report – Financial Review
/
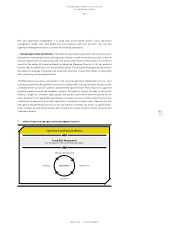
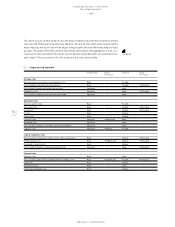
Risk and opportunity evaluation: In order to manage risks and opportunities in an effective way,
we evaluate identified risks and opportunities individually according to a systematic evaluation
methodology, which is applied consistently and allows adequate prioritisation as well as allocation
of resources. Risk and opportunity evaluation is also part of the Risk Owners’ responsibility. The
Group Risk Management department supports and guides the Risk Owners in the evaluation
process. According to our risk and opportunity management methodology, risks and opportunities
are evaluated by looking at two dimensions: the potential (financial) impact and the likelihood that
this impact materialises, both considering the upcoming twelve-month period. This, however,
does not mean that the respective Risk Owners are only looking at risks from a short-term
perspective. Their assessment also includes a mid-term (12 to 24 months) and long-term (beyond
24 months) perspective. The potential impact is evaluated by utilising five categories: marginal,
minor, moderate, significant and major. These categories represent quantitative or equivalent
qualitative measurements. The quantitative measurements are based on the potential financial
effect on the relevant income statement metrics (operating profit, financial result or tax expenses).
Qualitative measurements used are, for example, the degree of media exposure or additional senior
management attention needed. Likelihood represents the possibility that a given risk or opportunity
may materialise with the specific impact. The likelihood of individual risks and opportunities is
evaluated on a percentage scale divided into five categories: unlikely, possible, likely, probable and
highly probable.
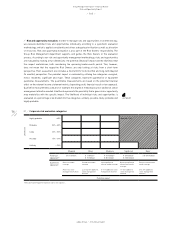
see Table 02
02
/
Corporate risk evaluation categories
Likelihood
Highly probable > 85%
Probable 50% – 85%
Likely 30% – 50%
Possible 15% – 30%
Unlikely < 15 %
Marginal Minor Moderate Significant Major
Financial
equivalent 1)
≤ € 1 million € 1 million –
€ 10 million
€ 10 million –
€ 50 million
€ 50 million –
€ 100 million
≥ € 100 million
Qualitative
equivalent
Almost no media
coverage
Almost no senior
management attention
Limited local media
coverage
Less than 5% additional
senior management
attention
Local and limited
national media coverage
5 – 10% additional senior
management attention
National and limited
international media
coverage
10 – 20% additional
senior management
attention
Extensive international
media coverage
Over 20% additional
senior management
attention
Potential impact
1) Based on operating profit, financial result or tax expenses.
Material risks