Reebok 2014 Annual Report Download - page 123
Download and view the complete annual report
Please find page 123 of the 2014 Reebok annual report below. You can navigate through the pages in the report by either clicking on the pages listed below, or by using the keyword search tool below to find specific information within the annual report.-
 1
1 -
2
-
3
-
4
-
5
-
6
-
7
-
8
-
9
-
10
-
11
-
12
-
13
-
14
-
15
-
16
-
17
-
18
-
19
-
20
-
21
-
22
-
23
-
24
-
25
-
26
-
27
-
28
-
29
-
30
-
31
-
32
-
33
-
34
-
35
-
36
-
37
-
38
-
39
-
40
-
41
-
42
-
43
-
44
-
45
-
46
-
47
-
48
-
49
-
50
-
51
-
52
-
53
-
54
-
55
-
56
-
57
-
58
-
59
-
60
-
61
-
62
-
63
-
64
-
65
-
66
-
67
-
68
-
69
-
70
-
71
-
72
-
73
-
74
-
75
-
76
-
77
-
78
-
79
-
80
-
81
-
82
-
83
-
84
-
85
-
86
-
87
-
88
-
89
-
90
-
91
-
92
-
93
-
94
-
95
-
96
-
97
-
98
-
99
-
100
-
101
-
102
-
103
-
104
-
105
-
106
-
107
-
108
-
109
-
110
-
111
-
112
-
 113
113 -
 114
114 -
 115
115 -
 116
116 -
 117
117 -
 118
118 -
 119
119 -
 120
120 -
 121
121 -
 122
122 -
 123
123 -
 124
124 -
 125
125 -
 126
126 -
 127
127 -
 128
128 -
 129
129 -
 130
130 -
 131
131 -
 132
132 -
 133
133 -
134
-
135
-
136
-
137
-
138
-
139
-
140
-
141
-
142
-
143
-
144
-
145
-
146
-
147
-
148
-
149
-
150
-
151
-
152
-
153
-
154
-
155
-
156
-
157
-
158
-
159
-
160
-
161
-
162
-
163
-
164
-
165
-
166
-
167
-
168
-
169
-
170
-
171
-
172
-
173
-
174
-
175
-
176
-
177
-
178
-
179
-
180
-
181
-
182
-
183
-
184
-
185
-
186
-
187
-
188
-
189
-
190
-
191
-
192
-
193
-
194
-
195
-
196
-
197
-
198
-
199
-
200
-
201
-
202
-
203
-
204
-
205
-
206
-
207
-
208
-
209
-
210
-
211
-
212
-
213
-
214
-
215
-
216
-
217
-
218
-
219
-
220
-
221
-
222
-
223
-
224
-
225
-
226
-
227
-
228
-
229
-
230
-
231
-
232
-
233
-
234
-
235
-
236
-
237
-
238
-
239
-
240
-
241
-
242
-
243
-
244
-
245
-
246
-
247
-
248
-
249
-
250
-
251
-
252
-
253
-
254
-
255
-
256
-
257
-
258
-
259
-
260
-
261
-
262
-
263
-
264
-
265
-
266
-
267
-
268
 |
 |
Group Management Report – Financial Review
119
2014
/
03.2
/
adidas Group
/
2014 Annual Report
Group Business Performance
/
Statement of Financial Position and Statement of Cash Flows
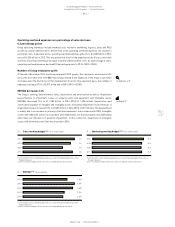
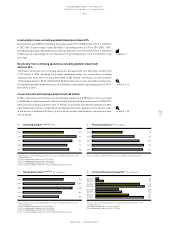
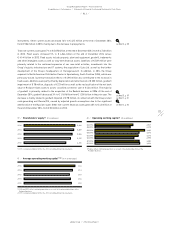
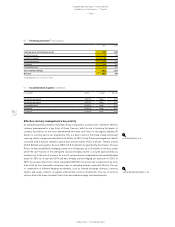
Total non-current liabilities increased 75% to € 2.422 billion at the end of December 2014 from
€ 1.386 billion in the prior year. Long-term borrowings increased to € 1.584 billion at the end of
December 2014 from € 653 million in the prior year. This development was primarily due to the
issuance of two Eurobonds with an overall volume of € 1 billion.
Shareholders’ equity increased 2% to € 5.624 billion at the end of December 2014 versus
€ 5.489 billion in 2013. The net income generated during the last twelve months, positive currency
translation effects of € 106 million as well as an increase in hedging reserves of € 210 million were
the main contributors to this development. This was partly offset by the dividend of € 314 million
paid to shareholders for the 2013 financial year as well as the repurchase of treasury shares in an
amount of € 300 million. The Group’s equity ratio at the end of December 2014 decreased to 45.3%
compared to 47.3% in the prior year.
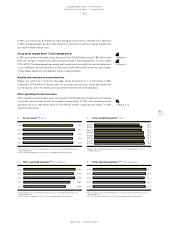
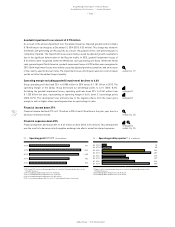
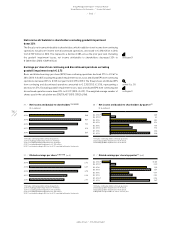
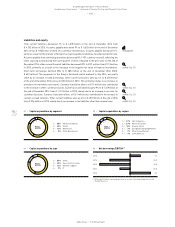
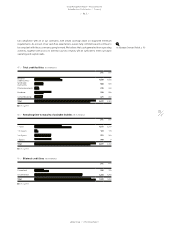
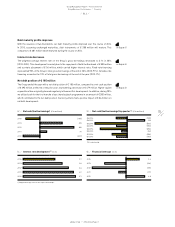
Operating working capital
Operating working capital increased 8% to € 2.821 billion at the end of December 2014 compared to
€ 2.618 billion in 2013. Operating working capital from continuing operations increased 12% (+13%
currency-neutral). This was mainly due to the increase in accounts receivable, reflecting the growth
of our business during the fourth quarter of 2014, as well as lower accounts payable at the end
of 2014. Average operating working capital as a percentage of sales from continuing operations
increased 1.0 percentage points to 22.4% (2013: 21.3%).
Investment analysis
Capital expenditure is defined as the total cash expenditure for the purchase of tangible and
intangible assets (excluding acquisitions). Group capital expenditure increased 16% to € 554 million
in 2014 (2013: € 479 million). Capital expenditure in property, plant and equipment amounted
to € 504 million and was thus above the prior year level of € 427 million. The Group invested
€ 50 million in intangible assets, representing a 4% decrease compared to the prior year (2013:
€ 52 million). Depreciation and amortisation excluding impairment losses/reversal of impairment
losses of tangible and intangible assets increased 10% to € 309 million in 2014 (2013: € 281 million).
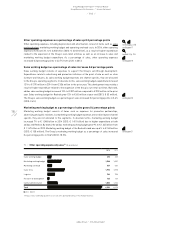
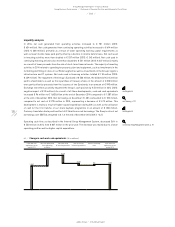
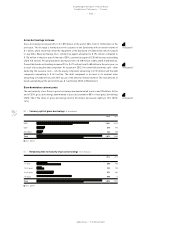
The majority of the Group’s capital expenditure was recorded in HQ/Consolidation, accounting for
58% (2013: 52%), and was mainly related to investments in the Group’s logistics infrastructure
and deployment of IT systems. The Retail segment accounted for 24% of the Group’s capital
expenditure (2013: 29%). Investments primarily related to the expansion of our store base for
the adidas and Reebok brands, particularly in emerging markets. Expenditure in the Wholesale
segment accounted for 13% of total capital expenditure (2013: 13%). Capital expenditure in Other
Businesses accounted for 5% of total expenditure (2013: 6%). From a regional perspective, capital
expenditure in North America accounted for 37% (2013: 16%) of the Group’s capital expenditure,
followed by Western Europe with 27% (2013: 41%), Greater China with 14% (2013: 13%), European
Emerging Markets with 7% (2013: 17%), Other Asian Markets with 7% (2013: 7%) and Latin
America with 7% (2013: 6%).
see Note 18, p. 213
see Diagram 39
see Note 26, p. 221
see Glossary, p. 258
see Diagram 40
see Diagram 41
see Diagram 42
see Diagram 43