Reebok 2014 Annual Report Download - page 204
Download and view the complete annual report
Please find page 204 of the 2014 Reebok annual report below. You can navigate through the pages in the report by either clicking on the pages listed below, or by using the keyword search tool below to find specific information within the annual report.-
 1
1 -
2
-
3
-
4
-
5
-
6
-
7
-
8
-
9
-
10
-
11
-
12
-
13
-
14
-
15
-
16
-
17
-
18
-
19
-
20
-
21
-
22
-
23
-
24
-
25
-
26
-
27
-
28
-
29
-
30
-
31
-
32
-
33
-
34
-
35
-
36
-
37
-
38
-
39
-
40
-
41
-
42
-
43
-
44
-
45
-
46
-
47
-
48
-
49
-
50
-
51
-
52
-
53
-
54
-
55
-
56
-
57
-
58
-
59
-
60
-
61
-
62
-
63
-
64
-
65
-
66
-
67
-
68
-
69
-
70
-
71
-
72
-
73
-
74
-
75
-
76
-
77
-
78
-
79
-
80
-
81
-
82
-
83
-
84
-
85
-
86
-
87
-
88
-
89
-
90
-
91
-
92
-
93
-
94
-
95
-
96
-
97
-
98
-
99
-
100
-
101
-
102
-
103
-
104
-
105
-
106
-
107
-
108
-
109
-
110
-
111
-
112
-
113
-
114
-
115
-
116
-
117
-
118
-
119
-
120
-
121
-
122
-
123
-
124
-
125
-
126
-
127
-
128
-
129
-
130
-
131
-
132
-
133
-
134
-
135
-
136
-
137
-
138
-
139
-
140
-
141
-
142
-
143
-
144
-
145
-
146
-
147
-
148
-
149
-
150
-
151
-
152
-
153
-
154
-
155
-
156
-
157
-
158
-
159
-
160
-
161
-
162
-
163
-
164
-
165
-
166
-
167
-
168
-
169
-
170
-
171
-
172
-
173
-
174
-
175
-
176
-
177
-
178
-
179
-
180
-
181
-
182
-
183
-
184
-
185
-
186
-
187
-
188
-
189
-
190
-
191
-
192
-
193
-
 194
194 -
 195
195 -
 196
196 -
 197
197 -
 198
198 -
 199
199 -
 200
200 -
 201
201 -
 202
202 -
 203
203 -
 204
204 -
 205
205 -
 206
206 -
 207
207 -
 208
208 -
 209
209 -
 210
210 -
 211
211 -
 212
212 -
 213
213 -
 214
214 -
215
-
216
-
217
-
218
-
219
-
220
-
221
-
222
-
223
-
224
-
225
-
226
-
227
-
228
-
229
-
230
-
231
-
232
-
233
-
234
-
235
-
236
-
237
-
238
-
239
-
240
-
241
-
242
-
243
-
244
-
245
-
246
-
247
-
248
-
249
-
250
-
251
-
252
-
253
-
254
-
255
-
256
-
257
-
258
-
259
-
260
-
261
-
262
-
263
-
264
-
265
-
266
-
267
-
268
 |
 |

adidas Group
/
2014 Annual Report
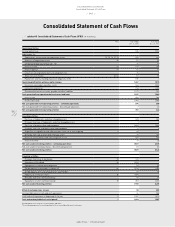
Consolidated Financial Statements
200
2014
Notes
/
04.8
/
The Group documents the relationship between hedging instruments and hedge objects at transaction inception,
as well as the risk management objectives and strategies for undertaking various hedge transactions. This
process includes linking all derivatives designated as hedges to specific firm commitments and forecasted
transactions. The Group also documents its assessment of whether the derivatives that are used in hedging
transactions are highly effective by using different methods of effectiveness testing, such as the ‘dollar offset
method’ or the ‘hypothetical derivative method’.
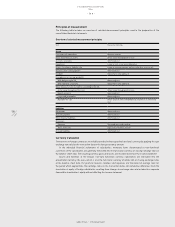
The fair values of currency options, forward exchange contracts and commodity futures are determined on
the basis of market conditions on the reporting dates. The fair value of a currency option is determined using
generally accepted models to calculate option prices. The fair market value of an option is influenced not only
by the remaining term of the option but also by additional factors, such as the actual foreign exchange rate and
the volatility of the underlying foreign currency base. Fair values are determined taking into consideration the
counterparty risk. Due to immateriality, no adjustment has been recorded. The adidas Group has exercised
the option to calculate the amounts on counterparty level according to IFRS 13 ‘Fair Value Measurement’,
paragraph 48.
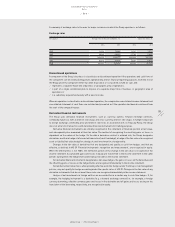
Cash and cash equivalents
Cash and cash equivalents represent cash at banks, cash on hand and short-term deposits with maturities of
three months or less from the date of acquisition.
Cash equivalents are short-term, highly liquid investments that are readily convertible to known amounts of
cash and which are subject to an insignificant risk of changes in value.
Receivables and other financial assets
Receivables and other financial assets are recognised at fair value, which corresponds to the nominal value for
current receivables and other financial assets. For non-current receivables and other financial assets, the fair
value is estimated as the present value of future cash flows discounted at the market rate of interest at the
balance sheet date. Subsequently, these are measured at amortised cost using the ‘effective interest method’.
Required allowances, if necessary, are determined on the basis of individual risk assessments, and on the ageing
structure of receivables past due.
Inventories
Merchandise and finished goods are valued at the lower of cost or net realisable value, which is the estimated
selling price in the ordinary course of business less the estimated costs of completion and the estimated costs
necessary to make the sale. Costs are determined using a standard valuation method: the ‘average cost method’.
Costs of finished goods include cost of raw materials, direct labour and the components of the manufacturing
overheads which can reasonably be attributed. The allocation of overheads is based on the planned average
utilisation. The net realisable value allowances are computed consistently throughout the Group based on the age
and expected future sales of the items on hand.
Assets/liabilities and disposal groups classified as held for sale
Assets/liabilities and disposal groups classified as held for sale are primarily non-current assets and liabilities
expected to be recovered principally through sale rather than through continuing use. These are measured at
the lower of their carrying amount and fair value less costs to sell. Assets classified as held for sale are not
depreciated on a straight-line basis.
Property, plant and equipment
Property, plant and equipment are measured at amortised cost. This comprises any costs directly attributable
to bringing the asset to the condition necessary for it to be capable of operating in the manner intended by
Management less accumulated depreciation (except for land and construction in progress) and accumulated
impairment losses. Depreciation is recognised over the estimated useful life utilising the ‘straight-line method’
and taking into account any potential residual value, except where the ‘declining-balance method’ is more
appropriate in light of the actual utilisation pattern. Parts of an item of property, plant and equipment with a cost
that is significant in relation to the total cost of the item are depreciated separately.