Reebok 2014 Annual Report Download - page 121
Download and view the complete annual report
Please find page 121 of the 2014 Reebok annual report below. You can navigate through the pages in the report by either clicking on the pages listed below, or by using the keyword search tool below to find specific information within the annual report.-
 1
1 -
2
-
3
-
4
-
5
-
6
-
7
-
8
-
9
-
10
-
11
-
12
-
13
-
14
-
15
-
16
-
17
-
18
-
19
-
20
-
21
-
22
-
23
-
24
-
25
-
26
-
27
-
28
-
29
-
30
-
31
-
32
-
33
-
34
-
35
-
36
-
37
-
38
-
39
-
40
-
41
-
42
-
43
-
44
-
45
-
46
-
47
-
48
-
49
-
50
-
51
-
52
-
53
-
54
-
55
-
56
-
57
-
58
-
59
-
60
-
61
-
62
-
63
-
64
-
65
-
66
-
67
-
68
-
69
-
70
-
71
-
72
-
73
-
74
-
75
-
76
-
77
-
78
-
79
-
80
-
81
-
82
-
83
-
84
-
85
-
86
-
87
-
88
-
89
-
90
-
91
-
92
-
93
-
94
-
95
-
96
-
97
-
98
-
99
-
100
-
101
-
102
-
103
-
104
-
105
-
106
-
107
-
108
-
109
-
110
-
 111
111 -
 112
112 -
 113
113 -
 114
114 -
 115
115 -
 116
116 -
 117
117 -
 118
118 -
 119
119 -
 120
120 -
 121
121 -
 122
122 -
 123
123 -
 124
124 -
 125
125 -
 126
126 -
 127
127 -
 128
128 -
 129
129 -
 130
130 -
 131
131 -
132
-
133
-
134
-
135
-
136
-
137
-
138
-
139
-
140
-
141
-
142
-
143
-
144
-
145
-
146
-
147
-
148
-
149
-
150
-
151
-
152
-
153
-
154
-
155
-
156
-
157
-
158
-
159
-
160
-
161
-
162
-
163
-
164
-
165
-
166
-
167
-
168
-
169
-
170
-
171
-
172
-
173
-
174
-
175
-
176
-
177
-
178
-
179
-
180
-
181
-
182
-
183
-
184
-
185
-
186
-
187
-
188
-
189
-
190
-
191
-
192
-
193
-
194
-
195
-
196
-
197
-
198
-
199
-
200
-
201
-
202
-
203
-
204
-
205
-
206
-
207
-
208
-
209
-
210
-
211
-
212
-
213
-
214
-
215
-
216
-
217
-
218
-
219
-
220
-
221
-
222
-
223
-
224
-
225
-
226
-
227
-
228
-
229
-
230
-
231
-
232
-
233
-
234
-
235
-
236
-
237
-
238
-
239
-
240
-
241
-
242
-
243
-
244
-
245
-
246
-
247
-
248
-
249
-
250
-
251
-
252
-
253
-
254
-
255
-
256
-
257
-
258
-
259
-
260
-
261
-
262
-
263
-
264
-
265
-
266
-
267
-
268
 |
 |
Group Management Report – Financial Review
117
2014
/
03.2
/
adidas Group
/
2014 Annual Report
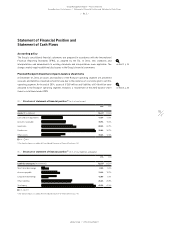
Group Business Performance
/
Statement of Financial Position and Statement of Cash Flows
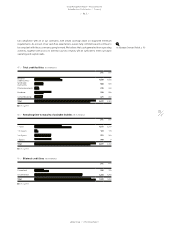
instruments. Other current assets decreased 16% to € 425 million at the end of December 2014
from € 506 million in 2013, mainly due to the decrease in prepayments.
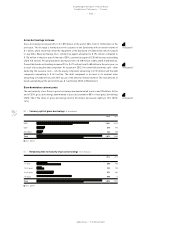
Total non-current assets grew 7% to € 5.070 billion at the end of December 2014 from € 4.742 billion
in 2013. Fixed assets increased 5% to € 4.346 billion at the end of December 2014 versus
€ 4.144 billion in 2013. Fixed assets include property, plant and equipment, goodwill, trademarks
and other intangible assets as well as long-term financial assets. Additions of € 569 million were
primarily related to the continued expansion of our own-retail activities, investments into the
Group’s logistics infrastructure and IT systems, the acquisition of Luta Ltd. as well as the further
development of the Group’s headquarters in Herzogenaurach. In addition, in 2014 the Group
acquired its North American Distribution Centre in Spartanburg, South Carolina (USA), which was
previously leased. Currency translation effects of € 290 million also contributed to the increase in
fixed assets. Additions were partly offset by depreciation and amortisation of € 333 million, goodwill
impairment of € 78 million, disposals of € 23 million as well as the reclassification of the net book
value of Rockport fixed assets to assets classified as held for sale of € 224 million. The majority
of goodwill is primarily related to the acquisition of the Reebok business in 2006. At the end of
December 2014, goodwill decreased 3% to € 1.169 billion from € 1.204 billion in the prior year. The
decrease is mainly related to goodwill impaired of € 78 million, in connection with the Group’s retail
cash-generating unit Russia/CIS, caused by adjusted growth assumptions due to the significant
deterioration of the Russian rouble. Other non-current financial assets grew 40% to € 42 million at
the end of December 2014 from € 30 million in 2013.
see Note 10, p. 209
see Note 02, p. 197
see Note 13, p. 211
see Note 16, p. 213
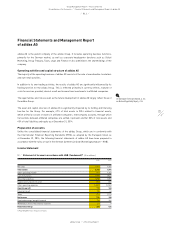
41
/
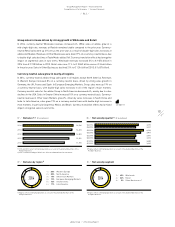
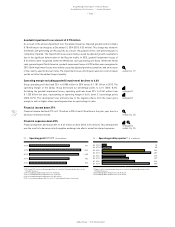
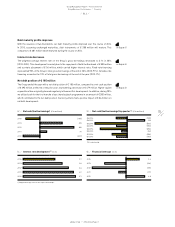
Average operating working capital 1) 2) (in % of net sales)
2014 22.4
2013 21.3
2012 20.0
2011 20.4
2010 20.8
1) 2014 and 2013 reflect continuing operations as a result of the planned divestiture of the
Rockport business.
2) 2011 restated according to IAS 8 in the 2012 consolidated financial statements.
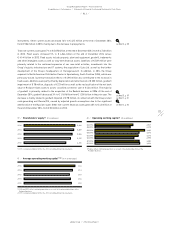
39
/
Shareholders’ equity 1) (€ in millions)
2014 5,624
2013 5,489
2012 5,304
2011 5,137
2010 4,616
1) 2011 restated according to IAS 8 in the 2012 consolidated financial statements.
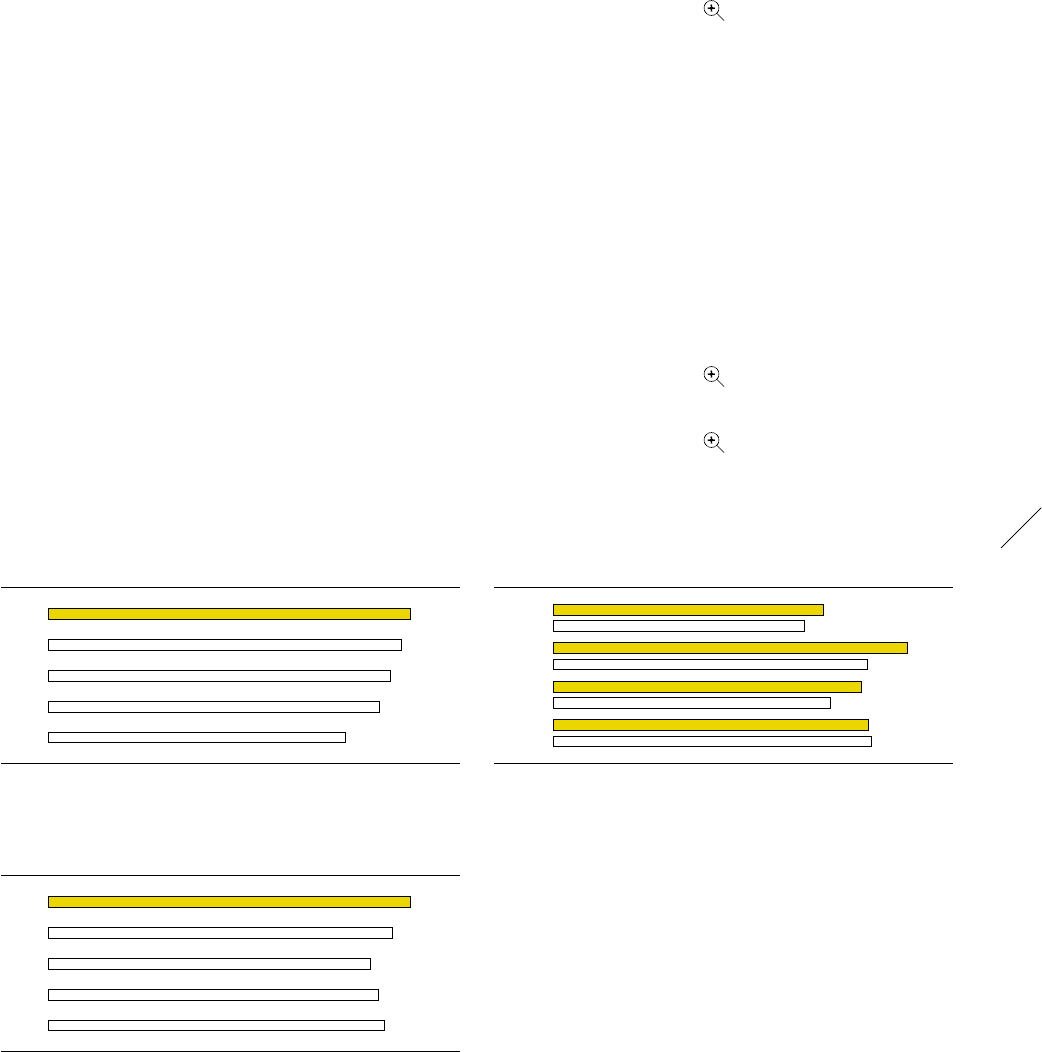
40
/
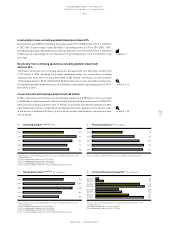
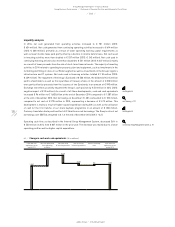
Operating working capital 1) (€ in millions)
Q4 2014 2,821
Q4 2013 2,618
Q3 2014 3,689
Q3 2013 3,273
Q2 2014 3,213
Q2 2013 2,895
Q1 2014 3,280
Q1 2013 3,324
1) Figures reflect continuing operations as a result of the planned divestiture of the
Rockport business.