Reebok 2014 Annual Report Download - page 244
Download and view the complete annual report
Please find page 244 of the 2014 Reebok annual report below. You can navigate through the pages in the report by either clicking on the pages listed below, or by using the keyword search tool below to find specific information within the annual report.-
 1
1 -
2
-
3
-
4
-
5
-
6
-
7
-
8
-
9
-
10
-
11
-
12
-
13
-
14
-
15
-
16
-
17
-
18
-
19
-
20
-
21
-
22
-
23
-
24
-
25
-
26
-
27
-
28
-
29
-
30
-
31
-
32
-
33
-
34
-
35
-
36
-
37
-
38
-
39
-
40
-
41
-
42
-
43
-
44
-
45
-
46
-
47
-
48
-
49
-
50
-
51
-
52
-
53
-
54
-
55
-
56
-
57
-
58
-
59
-
60
-
61
-
62
-
63
-
64
-
65
-
66
-
67
-
68
-
69
-
70
-
71
-
72
-
73
-
74
-
75
-
76
-
77
-
78
-
79
-
80
-
81
-
82
-
83
-
84
-
85
-
86
-
87
-
88
-
89
-
90
-
91
-
92
-
93
-
94
-
95
-
96
-
97
-
98
-
99
-
100
-
101
-
102
-
103
-
104
-
105
-
106
-
107
-
108
-
109
-
110
-
111
-
112
-
113
-
114
-
115
-
116
-
117
-
118
-
119
-
120
-
121
-
122
-
123
-
124
-
125
-
126
-
127
-
128
-
129
-
130
-
131
-
132
-
133
-
134
-
135
-
136
-
137
-
138
-
139
-
140
-
141
-
142
-
143
-
144
-
145
-
146
-
147
-
148
-
149
-
150
-
151
-
152
-
153
-
154
-
155
-
156
-
157
-
158
-
159
-
160
-
161
-
162
-
163
-
164
-
165
-
166
-
167
-
168
-
169
-
170
-
171
-
172
-
173
-
174
-
175
-
176
-
177
-
178
-
179
-
180
-
181
-
182
-
183
-
184
-
185
-
186
-
187
-
188
-
189
-
190
-
191
-
192
-
193
-
194
-
195
-
196
-
197
-
198
-
199
-
200
-
201
-
202
-
203
-
204
-
205
-
206
-
207
-
208
-
209
-
210
-
211
-
212
-
213
-
214
-
215
-
216
-
217
-
218
-
219
-
220
-
221
-
222
-
223
-
224
-
225
-
226
-
227
-
228
-
229
-
230
-
231
-
232
-
233
-
 234
234 -
 235
235 -
 236
236 -
 237
237 -
 238
238 -
 239
239 -
 240
240 -
 241
241 -
 242
242 -
 243
243 -
 244
244 -
 245
245 -
 246
246 -
 247
247 -
 248
248 -
 249
249 -
 250
250 -
 251
251 -
 252
252 -
 253
253 -
 254
254 -
255
-
256
-
257
-
258
-
259
-
260
-
261
-
262
-
263
-
264
-
265
-
266
-
267
-
268
 |
 |

adidas Group
/
2014 Annual Report
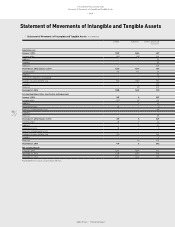
Consolidated Financial Statements
240
2014
/
04.8
/
Notes
/
Notes – Additional Information
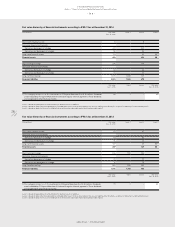
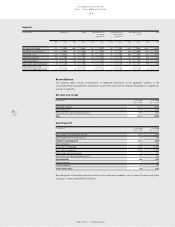
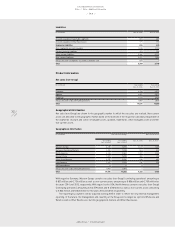
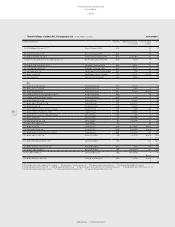
(€ in millions) Wholesale Retail Other Businesses
(continuing
operations)
Other Businesses
(discontinued
operations)
Other Businesses
(total)
Total
2014 2013 2014 2013 2014 2013 2014 2013 2014 2013 2014 2013
Net sales (non-Group) 9,376 9,100 3,842 3,446 1,316 1,657 283 289 1,599 1,946 14,817 14,492
Segmental operating profit 3,100 3,082 673 678 254 455 46 54 300 508 4,074 4,269
Segmental assets 2,945 2,763 799 898 706 621 139 128 846 749 4,590 4,410
Segmental liabilities 358 360 125 99 134 147 37 30 171 176 654 635
Capital expenditure 71 62 134 139 20 22 6 6 26 28 232 229
Depreciation and amortisation 52 45 93 87 7 6 7 5 14 11 159 143
Impairment losses and
reversals of impairment losses (1) 1 16 1 1 0 0 0 1 0 16 2
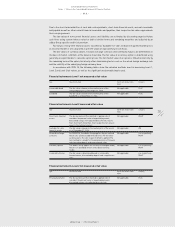
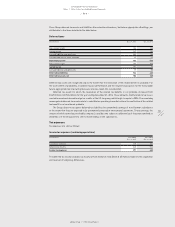
Reconciliations
The following tables include reconciliations of segmental information to the aggregate numbers of the
consolidated financial statements, taking into account items which are not directly attributable to a segment or
a group of segments.
Net sales (non-Group)
(€ in millions) Year ending
Dec. 31, 2014
Year ending
Dec. 31, 2013
Reportable segments 13,218 12,546
Other Businesses 1,599 1,946
Reclassification to discontinued operations (283) (289)
Total 14,534 14,203
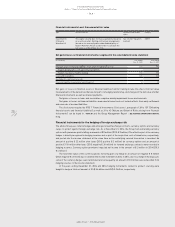
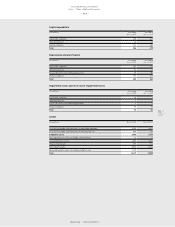
Operating profit
(€ in millions) Year ending
Dec. 31, 2014
Year ending
Dec. 31, 2013
Operating profit for reportable segments 3,774 3,760
Operating profit for Other Businesses 300 508
Segmental operating profit 4,074 4,269
HQ/Consolidation 245 293
Marketing working budget (1,548) (1,451)
Other operating expenses (1,944) (1,979)
Royalty and commission income 102 103
Reclassification to discontinued operations (46) (54)
Operating profit 883 1,181
Financial income 19 26
Financial expenses (67) (94)
Income before taxes 835 1,113
Operating profit of centralised functions which do not represent a segment, such as central treasury and global
sourcing, is shown under HQ/Consolidation.
Segments