Reebok 2014 Annual Report Download - page 132
Download and view the complete annual report
Please find page 132 of the 2014 Reebok annual report below. You can navigate through the pages in the report by either clicking on the pages listed below, or by using the keyword search tool below to find specific information within the annual report.-
 1
1 -
2
-
3
-
4
-
5
-
6
-
7
-
8
-
9
-
10
-
11
-
12
-
13
-
14
-
15
-
16
-
17
-
18
-
19
-
20
-
21
-
22
-
23
-
24
-
25
-
26
-
27
-
28
-
29
-
30
-
31
-
32
-
33
-
34
-
35
-
36
-
37
-
38
-
39
-
40
-
41
-
42
-
43
-
44
-
45
-
46
-
47
-
48
-
49
-
50
-
51
-
52
-
53
-
54
-
55
-
56
-
57
-
58
-
59
-
60
-
61
-
62
-
63
-
64
-
65
-
66
-
67
-
68
-
69
-
70
-
71
-
72
-
73
-
74
-
75
-
76
-
77
-
78
-
79
-
80
-
81
-
82
-
83
-
84
-
85
-
86
-
87
-
88
-
89
-
90
-
91
-
92
-
93
-
94
-
95
-
96
-
97
-
98
-
99
-
100
-
101
-
102
-
103
-
104
-
105
-
106
-
107
-
108
-
109
-
110
-
111
-
112
-
113
-
114
-
115
-
116
-
117
-
118
-
119
-
120
-
121
-
 122
122 -
 123
123 -
 124
124 -
 125
125 -
 126
126 -
 127
127 -
 128
128 -
 129
129 -
 130
130 -
 131
131 -
 132
132 -
 133
133 -
 134
134 -
 135
135 -
 136
136 -
 137
137 -
 138
138 -
 139
139 -
 140
140 -
 141
141 -
 142
142 -
143
-
144
-
145
-
146
-
147
-
148
-
149
-
150
-
151
-
152
-
153
-
154
-
155
-
156
-
157
-
158
-
159
-
160
-
161
-
162
-
163
-
164
-
165
-
166
-
167
-
168
-
169
-
170
-
171
-
172
-
173
-
174
-
175
-
176
-
177
-
178
-
179
-
180
-
181
-
182
-
183
-
184
-
185
-
186
-
187
-
188
-
189
-
190
-
191
-
192
-
193
-
194
-
195
-
196
-
197
-
198
-
199
-
200
-
201
-
202
-
203
-
204
-
205
-
206
-
207
-
208
-
209
-
210
-
211
-
212
-
213
-
214
-
215
-
216
-
217
-
218
-
219
-
220
-
221
-
222
-
223
-
224
-
225
-
226
-
227
-
228
-
229
-
230
-
231
-
232
-
233
-
234
-
235
-
236
-
237
-
238
-
239
-
240
-
241
-
242
-
243
-
244
-
245
-
246
-
247
-
248
-
249
-
250
-
251
-
252
-
253
-
254
-
255
-
256
-
257
-
258
-
259
-
260
-
261
-
262
-
263
-
264
-
265
-
266
-
267
-
268
 |
 |
128
2014
/
03.2
/
adidas Group
/
2014 Annual Report
Group Management Report – Financial Review
Group Business Performance
/
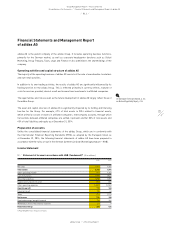
Financial Statements and Management Report of adidas AG
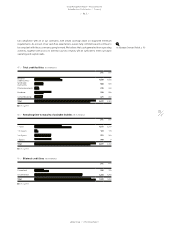
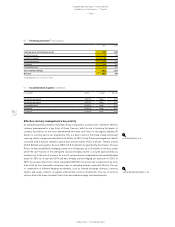
Net sales increase 10%
Sales of adidas AG comprise external revenues from adidas and Reebok products generated by
adidas Germany, external revenues from Y-3 products as well as Group-internal revenues from
foreign subsidiaries. Reported revenues also include royalty and commission income, mainly from
affiliated companies, and other revenues. In 2014, adidas AG net sales grew 10% to € 2.142 billion
(2013: € 1.954 billion). This growth is mainly due to an increase in royalty income from affiliated
companies as well as higher sales at adidas Germany.
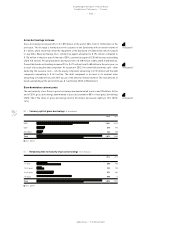
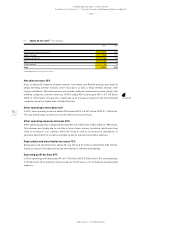
Other operating income down 44%
In 2014, other operating income of adidas AG decreased 44% to € 647 million (2013: € 1.165 billion).
This was primarily due to a decline in income from currency conversion.
Other operating expenses decrease 20%
Other operating expenses of adidas AG declined 20% to € 1.581 billion in 2014 (2013: € 1.981 billion).
This decrease was largely due to a decline in losses from currency translation, which more than
offset an increase in cost transfers within the Group as well as an increase in expenditure, in
particular depreciation of accounts receivable as well as legal and consultancy expenses.
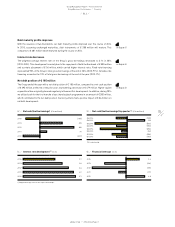
Depreciation and amortisation increases 12%
Depreciation and amortisation for adidas AG rose 12% to € 91 million in 2014 (2013: € 81 million),
mainly as a result of the depreciation and amortisation of software and buildings.
Operating profit declines 29%
In 2014, operating profit decreased 29% to € 119 million (2013: € 168 million). This was mainly due
to the decline in other operating income as well as the increase in cost of materials and personnel
expenses.
see Table 59
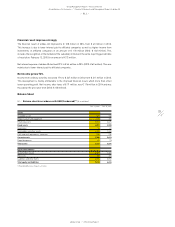
59
/
adidas AG net sales 1) (€ in millions)
2014 2013
Royalty and commission income 1,177 1,088
adidas Germany 798 701
Foreign subsidiaries 96 103
Y-3 51 44
Other revenues 20 18
Total 2,142 1,954
1) Rounding differences may arise in totals.