Reebok 2014 Annual Report Download - page 80
Download and view the complete annual report
Please find page 80 of the 2014 Reebok annual report below. You can navigate through the pages in the report by either clicking on the pages listed below, or by using the keyword search tool below to find specific information within the annual report.-
 1
1 -
2
-
3
-
4
-
5
-
6
-
7
-
8
-
9
-
10
-
11
-
12
-
13
-
14
-
15
-
16
-
17
-
18
-
19
-
20
-
21
-
22
-
23
-
24
-
25
-
26
-
27
-
28
-
29
-
30
-
31
-
32
-
33
-
34
-
35
-
36
-
37
-
38
-
39
-
40
-
41
-
42
-
43
-
44
-
45
-
46
-
47
-
48
-
49
-
50
-
51
-
52
-
53
-
54
-
55
-
56
-
57
-
58
-
59
-
60
-
61
-
62
-
63
-
64
-
65
-
66
-
67
-
68
-
69
-
 70
70 -
 71
71 -
 72
72 -
 73
73 -
 74
74 -
 75
75 -
 76
76 -
 77
77 -
 78
78 -
 79
79 -
 80
80 -
 81
81 -
 82
82 -
 83
83 -
 84
84 -
 85
85 -
 86
86 -
 87
87 -
 88
88 -
 89
89 -
 90
90 -
91
-
92
-
93
-
94
-
95
-
96
-
97
-
98
-
99
-
100
-
101
-
102
-
103
-
104
-
105
-
106
-
107
-
108
-
109
-
110
-
111
-
112
-
113
-
114
-
115
-
116
-
117
-
118
-
119
-
120
-
121
-
122
-
123
-
124
-
125
-
126
-
127
-
128
-
129
-
130
-
131
-
132
-
133
-
134
-
135
-
136
-
137
-
138
-
139
-
140
-
141
-
142
-
143
-
144
-
145
-
146
-
147
-
148
-
149
-
150
-
151
-
152
-
153
-
154
-
155
-
156
-
157
-
158
-
159
-
160
-
161
-
162
-
163
-
164
-
165
-
166
-
167
-
168
-
169
-
170
-
171
-
172
-
173
-
174
-
175
-
176
-
177
-
178
-
179
-
180
-
181
-
182
-
183
-
184
-
185
-
186
-
187
-
188
-
189
-
190
-
191
-
192
-
193
-
194
-
195
-
196
-
197
-
198
-
199
-
200
-
201
-
202
-
203
-
204
-
205
-
206
-
207
-
208
-
209
-
210
-
211
-
212
-
213
-
214
-
215
-
216
-
217
-
218
-
219
-
220
-
221
-
222
-
223
-
224
-
225
-
226
-
227
-
228
-
229
-
230
-
231
-
232
-
233
-
234
-
235
-
236
-
237
-
238
-
239
-
240
-
241
-
242
-
243
-
244
-
245
-
246
-
247
-
248
-
249
-
250
-
251
-
252
-
253
-
254
-
255
-
256
-
257
-
258
-
259
-
260
-
261
-
262
-
263
-
264
-
265
-
266
-
267
-
268
 |
 |
adidas Group
/
2014 Annual Report
Group Management Report – Our Group
76
2014
Research and Development
/
02.6
/
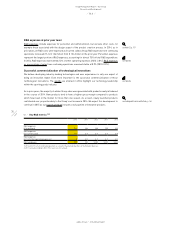
R&D expenses at prior year level
R&D expenses include expenses for personnel and administration, but exclude other costs, for
example those associated with the design aspect of the product creation process. In 2014, as in
prior years, all R&D costs were expensed as incurred. adidas Group R&D expenses from continuing
operations increased 2% to € 126 million from € 124 million in the prior year. Personnel expenses
represent the largest portion of R&D expenses, accounting for almost 75% of total R&D expenditure.
In 2014, R&D expenses represented 2.0% of other operating expenses (2013: 2.0%). R&D expenses
as a percentage of sales from continuing operations remained stable at 0.9% (2013: 0.9%).
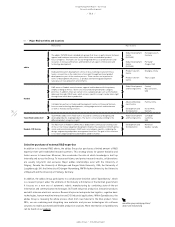
Successful commercialisation of technological innovations
We believe developing industry-leading technologies and user experiences is only one aspect of
being an innovation leader. Even more important is the successful commercialisation of those
technological innovations. The awards we attained in 2014 highlight our technology leadership
within the sporting goods industry.
As in prior years, the majority of adidas Group sales were generated with products newly introduced
in the course of 2014. New products tend to have a higher gross margin compared to products
which have been in the market for more than one season. As a result, newly launched products
contributed over-proportionately to the Group’s net income in 2014. We expect this development to
continue in 2015 as our launch schedule includes a full pipeline of innovative products.
see Note 02, p. 197
see Table 02
see Table 04
see Subsequent Events and Outlook, p. 146
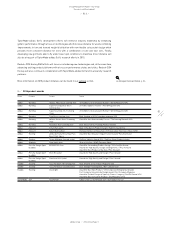
02
/
Key R&D metrics 1) 2)
2014 2013 2012 2011 2010
R&D expenses
(€ in millions) 126 124 128 115 102
R&D expenses
(in % of net sales) 0.9 0.9 0.9 0.9 0.8
R&D expenses
(in % of other operating expenses) 2.0 2.0 2.1 2.1 2.0
R&D employees 985 992 1,035 1,029 1,002
1) 2014 and 2013 reflect continuing operations as a result of the planned divestiture of the Rockport business.
2) 2011 restated according to IAS 8. Prior years are not restated.