Reebok 2014 Annual Report Download - page 242
Download and view the complete annual report
Please find page 242 of the 2014 Reebok annual report below. You can navigate through the pages in the report by either clicking on the pages listed below, or by using the keyword search tool below to find specific information within the annual report.-
 1
1 -
2
-
3
-
4
-
5
-
6
-
7
-
8
-
9
-
10
-
11
-
12
-
13
-
14
-
15
-
16
-
17
-
18
-
19
-
20
-
21
-
22
-
23
-
24
-
25
-
26
-
27
-
28
-
29
-
30
-
31
-
32
-
33
-
34
-
35
-
36
-
37
-
38
-
39
-
40
-
41
-
42
-
43
-
44
-
45
-
46
-
47
-
48
-
49
-
50
-
51
-
52
-
53
-
54
-
55
-
56
-
57
-
58
-
59
-
60
-
61
-
62
-
63
-
64
-
65
-
66
-
67
-
68
-
69
-
70
-
71
-
72
-
73
-
74
-
75
-
76
-
77
-
78
-
79
-
80
-
81
-
82
-
83
-
84
-
85
-
86
-
87
-
88
-
89
-
90
-
91
-
92
-
93
-
94
-
95
-
96
-
97
-
98
-
99
-
100
-
101
-
102
-
103
-
104
-
105
-
106
-
107
-
108
-
109
-
110
-
111
-
112
-
113
-
114
-
115
-
116
-
117
-
118
-
119
-
120
-
121
-
122
-
123
-
124
-
125
-
126
-
127
-
128
-
129
-
130
-
131
-
132
-
133
-
134
-
135
-
136
-
137
-
138
-
139
-
140
-
141
-
142
-
143
-
144
-
145
-
146
-
147
-
148
-
149
-
150
-
151
-
152
-
153
-
154
-
155
-
156
-
157
-
158
-
159
-
160
-
161
-
162
-
163
-
164
-
165
-
166
-
167
-
168
-
169
-
170
-
171
-
172
-
173
-
174
-
175
-
176
-
177
-
178
-
179
-
180
-
181
-
182
-
183
-
184
-
185
-
186
-
187
-
188
-
189
-
190
-
191
-
192
-
193
-
194
-
195
-
196
-
197
-
198
-
199
-
200
-
201
-
202
-
203
-
204
-
205
-
206
-
207
-
208
-
209
-
210
-
211
-
212
-
213
-
214
-
215
-
216
-
217
-
218
-
219
-
220
-
221
-
222
-
223
-
224
-
225
-
226
-
227
-
228
-
229
-
230
-
231
-
 232
232 -
 233
233 -
 234
234 -
 235
235 -
 236
236 -
 237
237 -
 238
238 -
 239
239 -
 240
240 -
 241
241 -
 242
242 -
 243
243 -
 244
244 -
 245
245 -
 246
246 -
 247
247 -
 248
248 -
 249
249 -
 250
250 -
 251
251 -
 252
252 -
253
-
254
-
255
-
256
-
257
-
258
-
259
-
260
-
261
-
262
-
263
-
264
-
265
-
266
-
267
-
268
 |
 |

adidas Group
/
2014 Annual Report
Consolidated Financial Statements
238
2014
/
04.8
/
Notes
/
Notes to the Consolidated Income Statement
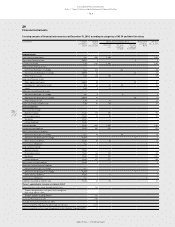
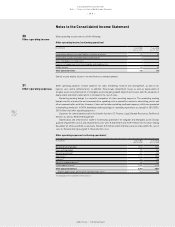
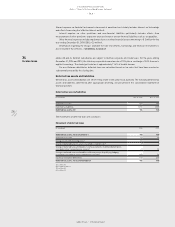
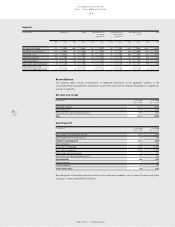
The effective tax rate of the Group differs from an assumed tax rate of 30% for the year ending December 31, 2014
as follows:
Tax rate reconciliation (continuing operations)
Year ending Dec. 31, 2014 Year ending Dec. 31, 2013
€ in millions in % € in millions in %
Expected income tax expenses 251 30.0 334 30.0
Tax rate differentials (117) (14.1) (133) (12.0)
Non-deductible expenses 18 2.2 82 7.4
Goodwill impairment losses 23 2.8 16 1.4
Losses for which benefits were not recognisable
and changes in valuation allowances 42 5.0 24 2.1
Changes in tax rates 6 0.7 (35) (3.1)
Other, net 1 0.1 1 0.1
224 26.8 289 25.9
Withholding tax expenses 47 5.6 51 4.6
Income tax expenses 271 32.5 340 30.5
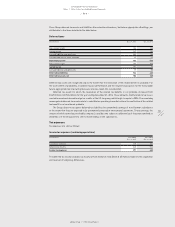
For 2013, the line item ‘Non-deductible expenses’ includes tax expenses of in total € 27 million related to the
resolution of domestic tax audits for prior years.
For 2014 and 2013, the effective tax rate is affected by non-tax-deductible goodwill impairment losses.
Excluding the goodwill impairment losses, the effective tax rate is 29.7% and 29.0%, respectively.
For 2014, the line item ‘Losses for which benefits were not recognisable and changes in valuation allowances’
mainly relates to changes in valuation allowances of the US tax group.
For 2013, the line item ‘Changes in tax rates’ mainly reflects a UK tax rate deduction effective in 2013.
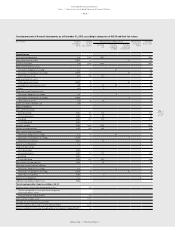
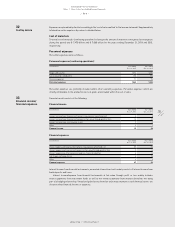
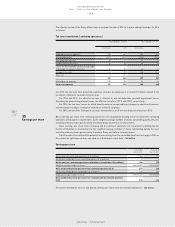
Basic earnings per share from continuing operations are calculated by dividing the net income from continuing
operations attributable to shareholders by the weighted average number of shares outstanding during the year,
excluding ordinary shares purchased by the adidas Group and held as treasury shares.
Basic earnings per share from continuing and discontinued operations are calculated by dividing the net
income attributable to shareholders by the weighted average number of shares outstanding during the year,
excluding ordinary shares purchased by the adidas Group and held as treasury shares.
A dilutive effect from 6.06 million potential shares arising from the convertible bond does not apply in 2014 as
the conversion right does not have any value as at the balance sheet date
/
SEE NOTE 18.
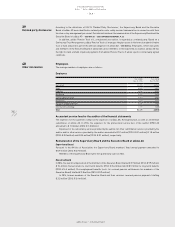
Earnings per share
Year ending
Dec. 31, 2014
Year ending
Dec. 31, 2013
Net income from continuing operations (€ in millions) 564 773
Net income attributable to non-controlling interests (€ in millions) 6 3
Net income from continuing operations attributable to shareholders (€ in millions) 558 770
Weighted average number of shares 208,776,457 209,216,186
Basic and diluted earnings per share from continuing operations (in €) 2.67 3.68
Net income attributable to shareholders (€ in millions) 490 787
Weighted average number of shares 208,776,457 209,216,186
Basic and diluted earnings per share from continuing and discontinued operations
(in €) 2.35 3.76
For further information on basic and diluted earnings per share from discontinued operations
/
SEE NOTE 03.
35
Earnings per share