Reebok 2014 Annual Report Download - page 113
Download and view the complete annual report
Please find page 113 of the 2014 Reebok annual report below. You can navigate through the pages in the report by either clicking on the pages listed below, or by using the keyword search tool below to find specific information within the annual report.-
 1
1 -
2
-
3
-
4
-
5
-
6
-
7
-
8
-
9
-
10
-
11
-
12
-
13
-
14
-
15
-
16
-
17
-
18
-
19
-
20
-
21
-
22
-
23
-
24
-
25
-
26
-
27
-
28
-
29
-
30
-
31
-
32
-
33
-
34
-
35
-
36
-
37
-
38
-
39
-
40
-
41
-
42
-
43
-
44
-
45
-
46
-
47
-
48
-
49
-
50
-
51
-
52
-
53
-
54
-
55
-
56
-
57
-
58
-
59
-
60
-
61
-
62
-
63
-
64
-
65
-
66
-
67
-
68
-
69
-
70
-
71
-
72
-
73
-
74
-
75
-
76
-
77
-
78
-
79
-
80
-
81
-
82
-
83
-
84
-
85
-
86
-
87
-
88
-
89
-
90
-
91
-
92
-
93
-
94
-
95
-
96
-
97
-
98
-
99
-
100
-
101
-
102
-
 103
103 -
 104
104 -
 105
105 -
 106
106 -
 107
107 -
 108
108 -
 109
109 -
 110
110 -
 111
111 -
 112
112 -
 113
113 -
 114
114 -
 115
115 -
 116
116 -
 117
117 -
 118
118 -
 119
119 -
 120
120 -
 121
121 -
 122
122 -
 123
123 -
124
-
125
-
126
-
127
-
128
-
129
-
130
-
131
-
132
-
133
-
134
-
135
-
136
-
137
-
138
-
139
-
140
-
141
-
142
-
143
-
144
-
145
-
146
-
147
-
148
-
149
-
150
-
151
-
152
-
153
-
154
-
155
-
156
-
157
-
158
-
159
-
160
-
161
-
162
-
163
-
164
-
165
-
166
-
167
-
168
-
169
-
170
-
171
-
172
-
173
-
174
-
175
-
176
-
177
-
178
-
179
-
180
-
181
-
182
-
183
-
184
-
185
-
186
-
187
-
188
-
189
-
190
-
191
-
192
-
193
-
194
-
195
-
196
-
197
-
198
-
199
-
200
-
201
-
202
-
203
-
204
-
205
-
206
-
207
-
208
-
209
-
210
-
211
-
212
-
213
-
214
-
215
-
216
-
217
-
218
-
219
-
220
-
221
-
222
-
223
-
224
-
225
-
226
-
227
-
228
-
229
-
230
-
231
-
232
-
233
-
234
-
235
-
236
-
237
-
238
-
239
-
240
-
241
-
242
-
243
-
244
-
245
-
246
-
247
-
248
-
249
-
250
-
251
-
252
-
253
-
254
-
255
-
256
-
257
-
258
-
259
-
260
-
261
-
262
-
263
-
264
-
265
-
266
-
267
-
268
 |
 |
Group Management Report – Financial Review
109
2014
/
03.2
/
adidas Group
/
2014 Annual Report
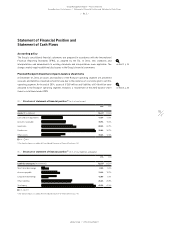
Group Business Performance
/
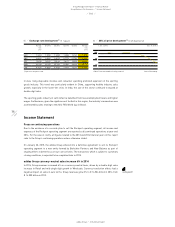
Income Statement
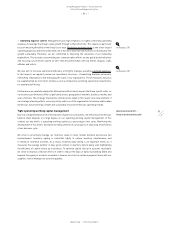
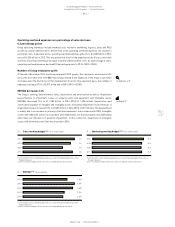
In 2014, cost of sales was € 7.610 billion, representing an increase of 6% compared to € 7.202 billion
in 2013. This development was due to the growth of our business as well as increases in input costs
as a result of higher labour costs.
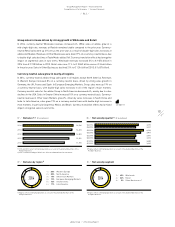
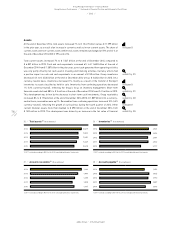
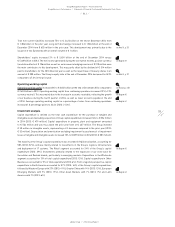
Group gross margin down 1.7 percentage points
In 2014, gross profit for the adidas Group decreased 1% to € 6.924 billion versus € 7.001 billion in the
prior year. The gross margin of the adidas Group decreased 1.7 percentage points to 47.6% in 2014
(2013: 49.3%). This development was mainly due to negative currency effects as well as higher input
costs. In addition, increased clearance activities particularly in Russia/CIS as well as lower margins
at TaylorMade-adidas Golf contributed to the gross margin decline.
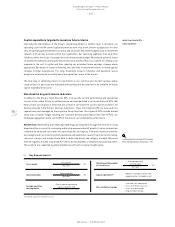
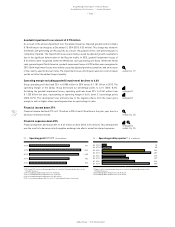
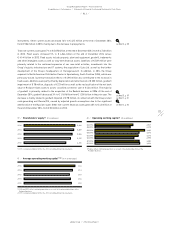
Royalty and commission income declines
Royalty and commission income for the adidas Group decreased 1% to € 102 million in 2014
compared to € 103 million in the prior year. On a currency-neutral basis, royalty and commission
income was also down 1%, mainly as a result of lower licensee sales at brand adidas.
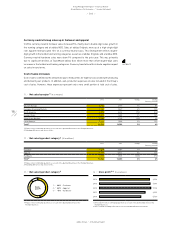
Other operating income decreases
Other operating income includes items such as gains from the disposal of fixed assets and releases
of accruals and provisions as well as insurance compensation. In 2014, other operating income
decreased 3% to € 138 million (2013: € 142 million), mainly comprising the release of other
operational provisions.
see Diagram 14
see Diagram 15
see Note 30, p. 234
15
/
Gross margin 1) 2) (in %)
2014 47.6
2013 49.3
2012 47.7
2011 47.5
2010 47.8
1) 2014 and 2013 reflect continuing operations as a result of the planned divestiture of the
Rockport business.
2) 2011 restated according to IAS 8 in the 2012 consolidated financial statements.
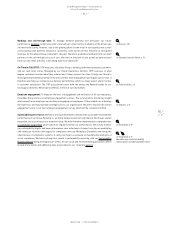
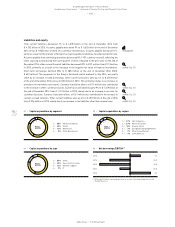
17
/
Other operating expenses 1) 2) (€ in millions)
2014 6,203
2013 6,013
2012 6,150
2011 5,567
2010 5,046
1) 2014 and 2013 reflect continuing operations as a result of the planned divestiture of the
Rockport business.
2) 2011 restated according to IAS 8 in the 2012 consolidated financial statements.
18
/
Other operating expenses 1) 2) (in % of net sales)
2014 42.7
2013 42.3
2012 41.3
2011 41.8
2010 42.1
1) 2014 and 2013 reflect continuing operations as a result of the planned divestiture of the
Rockport business.
2) 2011 restated according to IAS 8 in the 2012 consolidated financial statements.
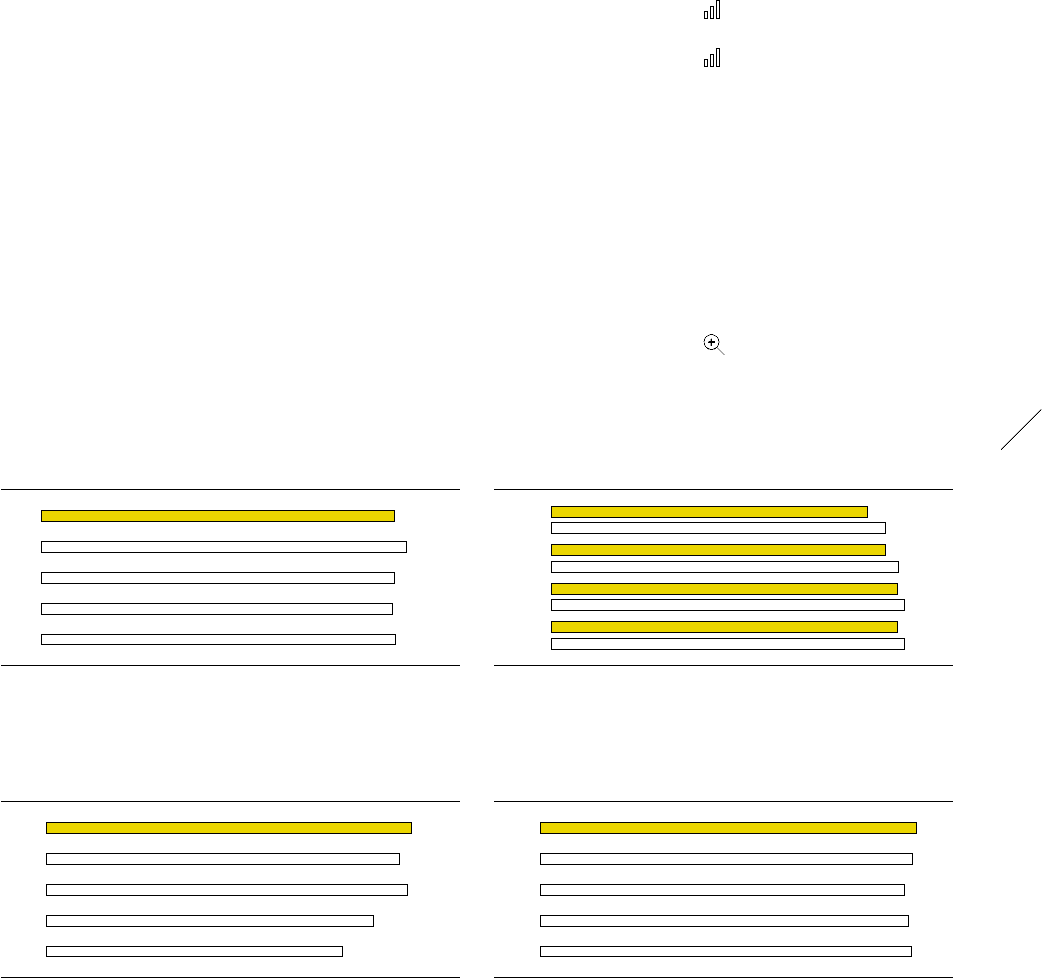
16
/
Gross margin by quarter 1) (in %)
Q4 2014 44.9
Q4 2013 47.5
Q3 2014 47.4
Q3 2013 49.3
Q2 2014 49.2
Q2 2013 50.1
Q1 2014 49.2
Q1 2013 50.2
1) Figures reflect continuing operations as a result of the planned divestiture of the
Rockport business.