Reebok 2014 Annual Report Download - page 258
Download and view the complete annual report
Please find page 258 of the 2014 Reebok annual report below. You can navigate through the pages in the report by either clicking on the pages listed below, or by using the keyword search tool below to find specific information within the annual report.-
 1
1 -
2
-
3
-
4
-
5
-
6
-
7
-
8
-
9
-
10
-
11
-
12
-
13
-
14
-
15
-
16
-
17
-
18
-
19
-
20
-
21
-
22
-
23
-
24
-
25
-
26
-
27
-
28
-
29
-
30
-
31
-
32
-
33
-
34
-
35
-
36
-
37
-
38
-
39
-
40
-
41
-
42
-
43
-
44
-
45
-
46
-
47
-
48
-
49
-
50
-
51
-
52
-
53
-
54
-
55
-
56
-
57
-
58
-
59
-
60
-
61
-
62
-
63
-
64
-
65
-
66
-
67
-
68
-
69
-
70
-
71
-
72
-
73
-
74
-
75
-
76
-
77
-
78
-
79
-
80
-
81
-
82
-
83
-
84
-
85
-
86
-
87
-
88
-
89
-
90
-
91
-
92
-
93
-
94
-
95
-
96
-
97
-
98
-
99
-
100
-
101
-
102
-
103
-
104
-
105
-
106
-
107
-
108
-
109
-
110
-
111
-
112
-
113
-
114
-
115
-
116
-
117
-
118
-
119
-
120
-
121
-
122
-
123
-
124
-
125
-
126
-
127
-
128
-
129
-
130
-
131
-
132
-
133
-
134
-
135
-
136
-
137
-
138
-
139
-
140
-
141
-
142
-
143
-
144
-
145
-
146
-
147
-
148
-
149
-
150
-
151
-
152
-
153
-
154
-
155
-
156
-
157
-
158
-
159
-
160
-
161
-
162
-
163
-
164
-
165
-
166
-
167
-
168
-
169
-
170
-
171
-
172
-
173
-
174
-
175
-
176
-
177
-
178
-
179
-
180
-
181
-
182
-
183
-
184
-
185
-
186
-
187
-
188
-
189
-
190
-
191
-
192
-
193
-
194
-
195
-
196
-
197
-
198
-
199
-
200
-
201
-
202
-
203
-
204
-
205
-
206
-
207
-
208
-
209
-
210
-
211
-
212
-
213
-
214
-
215
-
216
-
217
-
218
-
219
-
220
-
221
-
222
-
223
-
224
-
225
-
226
-
227
-
228
-
229
-
230
-
231
-
232
-
233
-
234
-
235
-
236
-
237
-
238
-
239
-
240
-
241
-
242
-
243
-
244
-
245
-
246
-
247
-
 248
248 -
 249
249 -
 250
250 -
 251
251 -
 252
252 -
 253
253 -
 254
254 -
 255
255 -
 256
256 -
 257
257 -
 258
258 -
 259
259 -
 260
260 -
 261
261 -
 262
262 -
 263
263 -
 264
264 -
 265
265 -
 266
266 -
 267
267 -
 268
268
 |
 |
1
adidas Group
/
2014 Annual Report
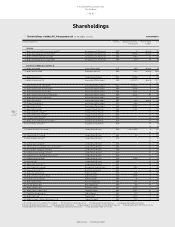
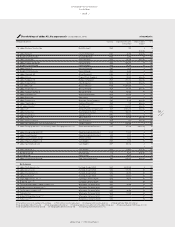
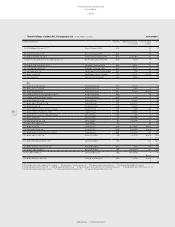
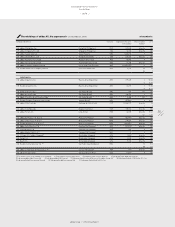
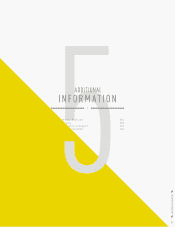
Additional Information
254
2014
/
05.1
/
Ten-Year Overview
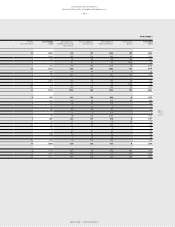
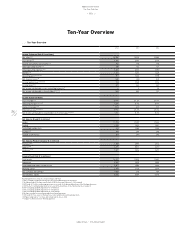
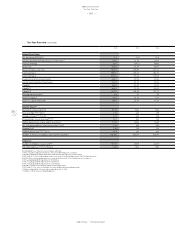
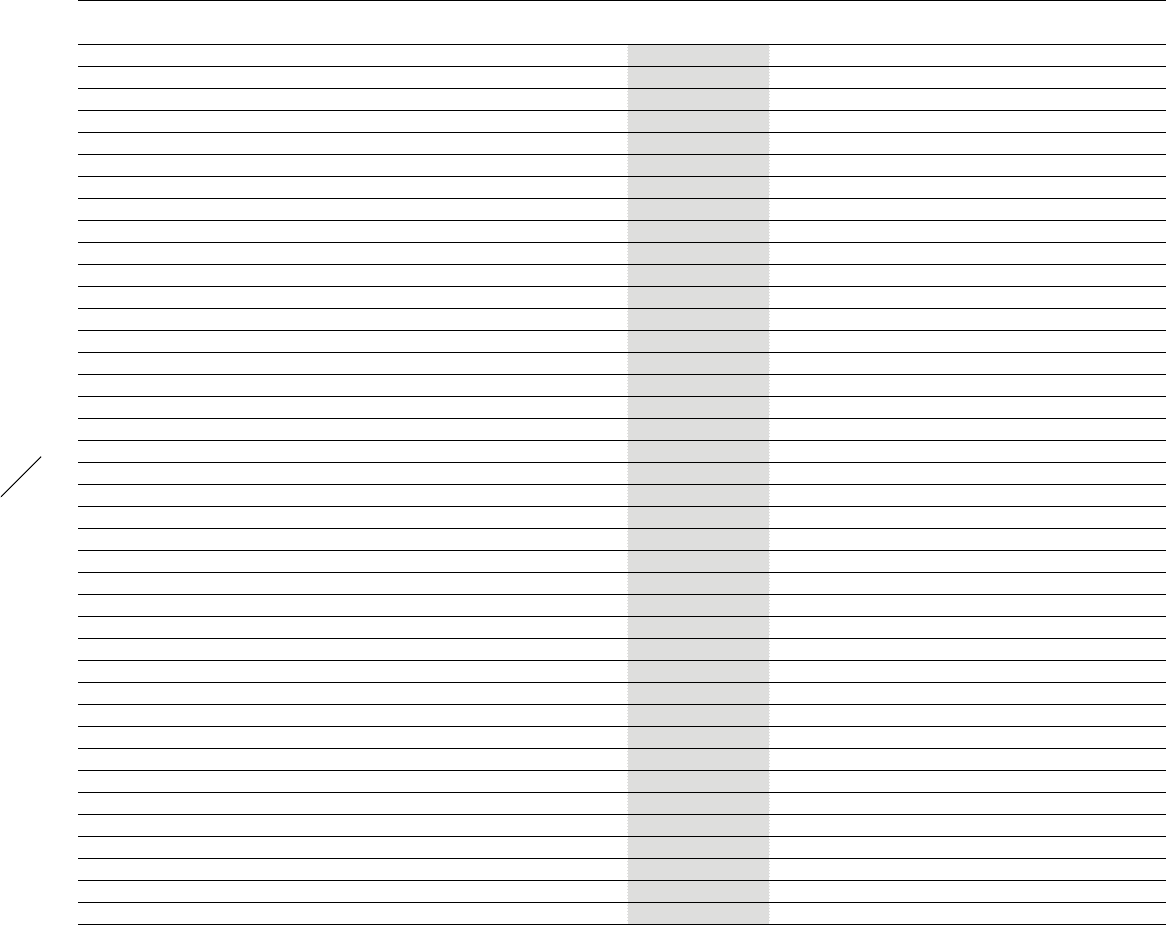
Ten-Year Overview
Rounding differences may arise in percentages and totals.
1) 2011 restated according to IAS 8 in the 2012 consolidated financial statements.
2) Including Reebok, Rockport and Reebok-CCM Hockey from February 1, 2006 onwards.
3) 2014 and 2013 reflect continuing operations as a result of the planned divestiture of the Rockport business.
4) 2005 reflects continuing operations as a result of the divestiture of the Salomon business segment.
5) 2014 excluding goodwill impairment of € 78 million.
6) 2013 excluding goodwill impairment of € 52 million.
7) 2012 excluding goodwill impairment of € 265 million.
8) Includes income from continuing and discontinued operations.
9) 2014 and 2013 net sales for Rockport are reflected within discontinued operations.
10) Figures adjusted for 1: 4 share split conducted on June 6, 2006.
11) Subject to Annual General Meeting approval.
..
/
Ten-Year Overview
2014 2013 2012
Income Statement Data (€ in millions)
Net sales 3) 4) 14,534 14,203 14,883
Gross profit 3) 4) 6,924 7,001 7,103
Royalty and commission income 3) 4) 102 103 105
Other operating income 3) 4) 138 142 127
Other operating expenses 3) 4) 6,203 6,013 6,150
EBITDA 3) 4) 1,283 1,496 1,445
Operating profit 3) 4) 5) 6) 7) 961 1,233 1,185
Net financial result 4) (48) (68) (69)
Income before taxes 3) 4) 5) 6) 7) 913 1,165 1,116
Income taxes 3) 4) 271 340 327
Net income attributable to non-controlling interests 4) 6 3 (2)
Net income attributable to shareholders 5) 6) 7) 8) 568 839 791
Income Statement Ratios
Gross margin 3) 4) 47.6% 49.3% 47.7%
Operating margin 3) 4) 5) 6) 7) 6.6% 8.7% 8.0%
Interest coverage 3) 4) 19.3 24.0 14.6
Effective tax rate 3) 4) 5) 6) 7) 29.7% 29.2% 29.3%
Net income attributable to shareholders in % of net sales 5) 6) 7) 8) 3.9% 5.9% 5.3%
Net Sales by Brand (€ in millions)
adidas 11,774 11,059 11,344
Reebok 1,578 1,599 1,667
TaylorMade-adidas Golf 913 1,285 1,344
Rockport 9) 283 289 285
Reebok-CCM Hockey 269 260 243
Net Sales by Product Category (€ in millions)
Footwear 3) 4) 6,658 6,587 6,922
Apparel 3) 4) 6,279 5,811 6,290
Hardware 3) 4) 1,597 1,806 1,671
Balance Sheet Data (€ in millions)
Total assets 12,417 11,599 11,651
Inventories 2,526 2,634 2,486
Receivables and other current assets 2,861 2,583 2,444
Working capital 2,970 2,125 2,504
Net cash/(net borrowings) (185) 295 448
Shareholders’ equity 5,624 5,489 5,304