Reebok 2014 Annual Report Download - page 108
Download and view the complete annual report
Please find page 108 of the 2014 Reebok annual report below. You can navigate through the pages in the report by either clicking on the pages listed below, or by using the keyword search tool below to find specific information within the annual report.-
 1
1 -
2
-
3
-
4
-
5
-
6
-
7
-
8
-
9
-
10
-
11
-
12
-
13
-
14
-
15
-
16
-
17
-
18
-
19
-
20
-
21
-
22
-
23
-
24
-
25
-
26
-
27
-
28
-
29
-
30
-
31
-
32
-
33
-
34
-
35
-
36
-
37
-
38
-
39
-
40
-
41
-
42
-
43
-
44
-
45
-
46
-
47
-
48
-
49
-
50
-
51
-
52
-
53
-
54
-
55
-
56
-
57
-
58
-
59
-
60
-
61
-
62
-
63
-
64
-
65
-
66
-
67
-
68
-
69
-
70
-
71
-
72
-
73
-
74
-
75
-
76
-
77
-
78
-
79
-
80
-
81
-
82
-
83
-
84
-
85
-
86
-
87
-
88
-
89
-
90
-
91
-
92
-
93
-
94
-
95
-
96
-
97
-
 98
98 -
 99
99 -
 100
100 -
 101
101 -
 102
102 -
 103
103 -
 104
104 -
 105
105 -
 106
106 -
 107
107 -
 108
108 -
 109
109 -
 110
110 -
 111
111 -
 112
112 -
 113
113 -
 114
114 -
 115
115 -
 116
116 -
 117
117 -
 118
118 -
119
-
120
-
121
-
122
-
123
-
124
-
125
-
126
-
127
-
128
-
129
-
130
-
131
-
132
-
133
-
134
-
135
-
136
-
137
-
138
-
139
-
140
-
141
-
142
-
143
-
144
-
145
-
146
-
147
-
148
-
149
-
150
-
151
-
152
-
153
-
154
-
155
-
156
-
157
-
158
-
159
-
160
-
161
-
162
-
163
-
164
-
165
-
166
-
167
-
168
-
169
-
170
-
171
-
172
-
173
-
174
-
175
-
176
-
177
-
178
-
179
-
180
-
181
-
182
-
183
-
184
-
185
-
186
-
187
-
188
-
189
-
190
-
191
-
192
-
193
-
194
-
195
-
196
-
197
-
198
-
199
-
200
-
201
-
202
-
203
-
204
-
205
-
206
-
207
-
208
-
209
-
210
-
211
-
212
-
213
-
214
-
215
-
216
-
217
-
218
-
219
-
220
-
221
-
222
-
223
-
224
-
225
-
226
-
227
-
228
-
229
-
230
-
231
-
232
-
233
-
234
-
235
-
236
-
237
-
238
-
239
-
240
-
241
-
242
-
243
-
244
-
245
-
246
-
247
-
248
-
249
-
250
-
251
-
252
-
253
-
254
-
255
-
256
-
257
-
258
-
259
-
260
-
261
-
262
-
263
-
264
-
265
-
266
-
267
-
268
 |
 |

104
2014
/
03.2
/
adidas Group
/
2014 Annual Report
Group Management Report – Financial Review
Group Business Performance
/
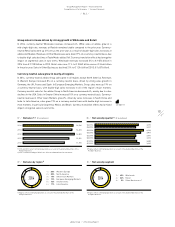
Economic and Sector Development
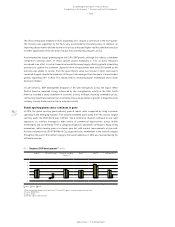
01
/
Regional GDP development 1) (in %)
Global 2) Western Europe 3) European emerging
markets 3)
USA 2) Asia 3) 4) Latin America 3)
5
4
3
2
1
0
–1
■ 2012 ■ 2013 ■ 2014
1) Real, percentage change versus prior year; 2012 and 2013 figures restated compared to prior year.
2) Source: World Bank.
3) Source: HSBC.
4) Includes Japan and Area Pacific.
The US economy grew modestly in 2014, expanding 2.4%, despite a contraction in the first quarter.
The recovery was supported by the Fed’s very accommodative monetary policy. In addition, an
improving labour market and the decline in oil prices stimulated higher real household income, but
a further appreciation of the US dollar may put the currently robust exports at risk.
Asia remained the fastest-growing region with 3.9% GDP growth, although this reflects a slowdown
compared to previous years. In China, growth slowed marginally to 7.5% as policy measures
introduced in an effort to control financial vulnerabilities were largely offset by growth-stimulating
provisions to cushion the slowdown. Japan fell short of expectations with only 0.2% growth as the
economy was unable to recover from the government’s sales tax increase in April, and exports
remained sluggish despite the weakness of the yen. India emerged from two years of more modest
growth, expanding 5.5% in 2014. This mainly reflects increasing export momentum and a sharp
decline in inflation.
In Latin America, GDP development dropped to 1.0% with divergences across the region. While
Central America remained strong, influenced by the strengthening activity in the USA, South
America recorded a sharp slowdown in economic activity. In Brazil, declining commodity prices,
contracting investments and election uncertainty drove a steep decline in growth. In Argentina, hard
currency scarcity drove a contraction in economic activity.
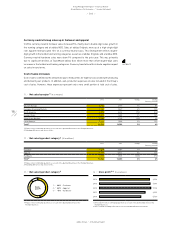
Global sporting goods sector continues to grow
In 2014, the global sporting goods industry grew at robust rates, supported by rising consumer
spending in the emerging markets. The industry benefited particularly from the world’s largest
sporting event, the FIFA World Cup in Brazil. The e-commerce channel continued to see rapid
expansion, as retailers leveraged a wide variety of commercial opportunities across mobile
technologies and social media. From a category perspective, basketball continued to enjoy strong
momentum, while running grew at a slower pace but with modest improvements at year-end.
Activities relating to the 2014 FIFA World Cup supported sales momentum in the football category
throughout the year. In the outdoor category, the overall weakness in 2014 was reversed during the
fall/winter season.