Reebok 2014 Annual Report Download - page 148
Download and view the complete annual report
Please find page 148 of the 2014 Reebok annual report below. You can navigate through the pages in the report by either clicking on the pages listed below, or by using the keyword search tool below to find specific information within the annual report.-
 1
1 -
2
-
3
-
4
-
5
-
6
-
7
-
8
-
9
-
10
-
11
-
12
-
13
-
14
-
15
-
16
-
17
-
18
-
19
-
20
-
21
-
22
-
23
-
24
-
25
-
26
-
27
-
28
-
29
-
30
-
31
-
32
-
33
-
34
-
35
-
36
-
37
-
38
-
39
-
40
-
41
-
42
-
43
-
44
-
45
-
46
-
47
-
48
-
49
-
50
-
51
-
52
-
53
-
54
-
55
-
56
-
57
-
58
-
59
-
60
-
61
-
62
-
63
-
64
-
65
-
66
-
67
-
68
-
69
-
70
-
71
-
72
-
73
-
74
-
75
-
76
-
77
-
78
-
79
-
80
-
81
-
82
-
83
-
84
-
85
-
86
-
87
-
88
-
89
-
90
-
91
-
92
-
93
-
94
-
95
-
96
-
97
-
98
-
99
-
100
-
101
-
102
-
103
-
104
-
105
-
106
-
107
-
108
-
109
-
110
-
111
-
112
-
113
-
114
-
115
-
116
-
117
-
118
-
119
-
120
-
121
-
122
-
123
-
124
-
125
-
126
-
127
-
128
-
129
-
130
-
131
-
132
-
133
-
134
-
135
-
136
-
137
-
 138
138 -
 139
139 -
 140
140 -
 141
141 -
 142
142 -
 143
143 -
 144
144 -
 145
145 -
 146
146 -
 147
147 -
 148
148 -
 149
149 -
 150
150 -
 151
151 -
 152
152 -
 153
153 -
 154
154 -
 155
155 -
 156
156 -
 157
157 -
 158
158 -
159
-
160
-
161
-
162
-
163
-
164
-
165
-
166
-
167
-
168
-
169
-
170
-
171
-
172
-
173
-
174
-
175
-
176
-
177
-
178
-
179
-
180
-
181
-
182
-
183
-
184
-
185
-
186
-
187
-
188
-
189
-
190
-
191
-
192
-
193
-
194
-
195
-
196
-
197
-
198
-
199
-
200
-
201
-
202
-
203
-
204
-
205
-
206
-
207
-
208
-
209
-
210
-
211
-
212
-
213
-
214
-
215
-
216
-
217
-
218
-
219
-
220
-
221
-
222
-
223
-
224
-
225
-
226
-
227
-
228
-
229
-
230
-
231
-
232
-
233
-
234
-
235
-
236
-
237
-
238
-
239
-
240
-
241
-
242
-
243
-
244
-
245
-
246
-
247
-
248
-
249
-
250
-
251
-
252
-
253
-
254
-
255
-
256
-
257
-
258
-
259
-
260
-
261
-
262
-
263
-
264
-
265
-
266
-
267
-
268
 |
 |
144
2014
/
03.3
/
adidas Group
/
2014 Annual Report
Group Management Report – Financial Review
Business Performance by Segment
/
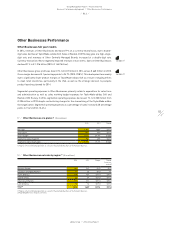
Other Businesses Performance
Segmental operating profit decreased 44% to € 254 million in 2014 versus € 455 million in the
prior year. Segmental operating margin was down 8.1 percentage points to 19.3% from 27.4% in
2013. This was a result of the gross margin decrease as well as the negative impact from higher
segmental operating expenses as a percentage of sales.
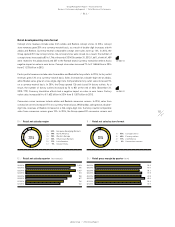
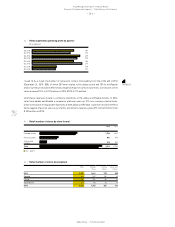
Other Businesses development by region
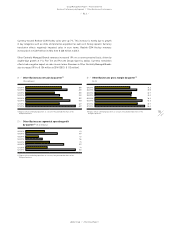
In 2014, currency-neutral sales of Other Businesses decreased in most regions. Revenues in
Western Europe were down 5% on a currency-neutral basis due to double-digit sales declines at
TaylorMade-adidas Golf, which more than offset double-digit sales increases at Other Centrally
Managed Brands. Revenues at Reebok-CCM Hockey decreased at a low-single-digit rate. Sales
in European Emerging Markets increased 7% on a currency-neutral basis. Strong double-digit
sales growth at Reebok-CCM Hockey was partly offset by sales declines at TaylorMade-adidas
Golf. Currency-neutral sales in North America were down 18%, due to double-digit decreases at
TaylorMade-adidas Golf. Revenues at Reebok-CCM Hockey increased at a high-single-digit rate,
while sales at Other Centrally Managed Brands grew at a double-digit rate. Revenues in Greater
China, Other Asian Markets and Latin America decreased 31%, 35% and 20%, respectively, due to
double-digit sales decreases at TaylorMade-adidas Golf. Currency translation effects had a mixed
impact on regional sales in euro terms.
Other Businesses development by segment
In 2014, TaylorMade-adidas Golf revenues decreased 28% on a currency-neutral basis. The
pronounced decrease is due to TaylorMade-adidas Golf’s strategic decision to clean retail
inventories in the golf market and postpone product launches planned for 2014. This resulted in
double-digit sales declines in metalwoods and irons in 2014. Currency translation effects negatively
impacted TaylorMade-adidas Golf sales in euro terms. Revenues decreased 29% to € 913 million
from € 1.285 billion in the prior year.
see Table 17
see Table 18
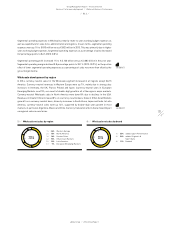
20
/
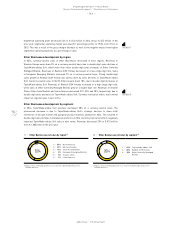
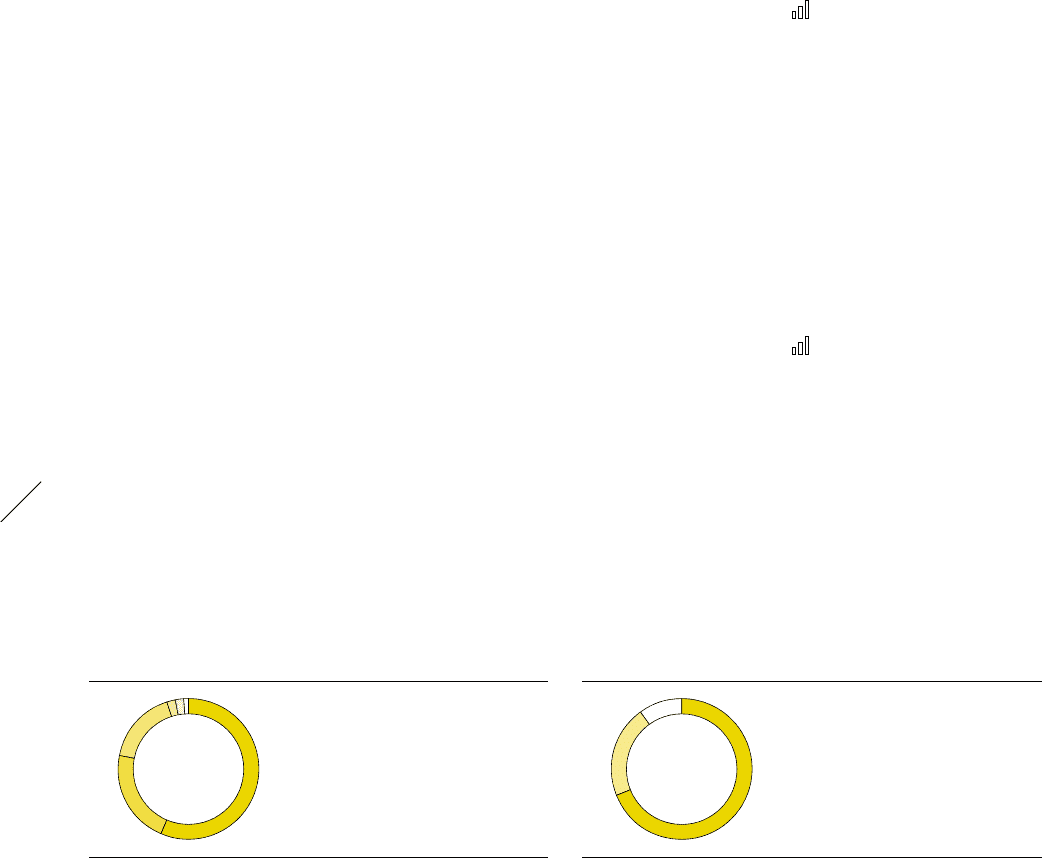
Other Businesses net sales by segment
1)
1) Figures reflect continuing operations as a result of the planned divestiture of the
Rockport business.
1
/
69% TaylorMade-adidas Golf
2
/
20% Reebok-CCM Hockey
3
/
10% Other Centrally Managed
Brands
19
/
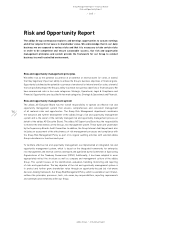
Other Businesses net sales by region 1)
1) Figures reflect continuing operations as a result of the planned divestiture of the
Rockport business.
1
/
57% North America
2
/
21% Western Europe
3
/
17% Other Asian Markets
4
/
2% European Emerging Markets
5
/
2% Greater China
6
/
1% Latin America
2014
1
2
3
2014
6
5
1
2
3
4