Reebok 2014 Annual Report Download - page 109
Download and view the complete annual report
Please find page 109 of the 2014 Reebok annual report below. You can navigate through the pages in the report by either clicking on the pages listed below, or by using the keyword search tool below to find specific information within the annual report.-
 1
1 -
2
-
3
-
4
-
5
-
6
-
7
-
8
-
9
-
10
-
11
-
12
-
13
-
14
-
15
-
16
-
17
-
18
-
19
-
20
-
21
-
22
-
23
-
24
-
25
-
26
-
27
-
28
-
29
-
30
-
31
-
32
-
33
-
34
-
35
-
36
-
37
-
38
-
39
-
40
-
41
-
42
-
43
-
44
-
45
-
46
-
47
-
48
-
49
-
50
-
51
-
52
-
53
-
54
-
55
-
56
-
57
-
58
-
59
-
60
-
61
-
62
-
63
-
64
-
65
-
66
-
67
-
68
-
69
-
70
-
71
-
72
-
73
-
74
-
75
-
76
-
77
-
78
-
79
-
80
-
81
-
82
-
83
-
84
-
85
-
86
-
87
-
88
-
89
-
90
-
91
-
92
-
93
-
94
-
95
-
96
-
97
-
98
-
 99
99 -
 100
100 -
 101
101 -
 102
102 -
 103
103 -
 104
104 -
 105
105 -
 106
106 -
 107
107 -
 108
108 -
 109
109 -
 110
110 -
 111
111 -
 112
112 -
 113
113 -
 114
114 -
 115
115 -
 116
116 -
 117
117 -
 118
118 -
 119
119 -
120
-
121
-
122
-
123
-
124
-
125
-
126
-
127
-
128
-
129
-
130
-
131
-
132
-
133
-
134
-
135
-
136
-
137
-
138
-
139
-
140
-
141
-
142
-
143
-
144
-
145
-
146
-
147
-
148
-
149
-
150
-
151
-
152
-
153
-
154
-
155
-
156
-
157
-
158
-
159
-
160
-
161
-
162
-
163
-
164
-
165
-
166
-
167
-
168
-
169
-
170
-
171
-
172
-
173
-
174
-
175
-
176
-
177
-
178
-
179
-
180
-
181
-
182
-
183
-
184
-
185
-
186
-
187
-
188
-
189
-
190
-
191
-
192
-
193
-
194
-
195
-
196
-
197
-
198
-
199
-
200
-
201
-
202
-
203
-
204
-
205
-
206
-
207
-
208
-
209
-
210
-
211
-
212
-
213
-
214
-
215
-
216
-
217
-
218
-
219
-
220
-
221
-
222
-
223
-
224
-
225
-
226
-
227
-
228
-
229
-
230
-
231
-
232
-
233
-
234
-
235
-
236
-
237
-
238
-
239
-
240
-
241
-
242
-
243
-
244
-
245
-
246
-
247
-
248
-
249
-
250
-
251
-
252
-
253
-
254
-
255
-
256
-
257
-
258
-
259
-
260
-
261
-
262
-
263
-
264
-
265
-
266
-
267
-
268
 |
 |

Group Management Report – Financial Review
105
2014
/
03.2
/
adidas Group
/
2014 Annual Report
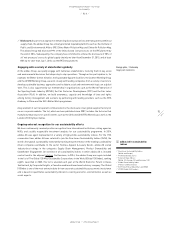
Group Business Performance
/
Economic and Sector Development
03
/
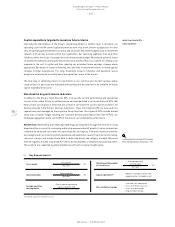
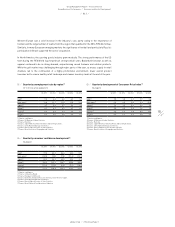
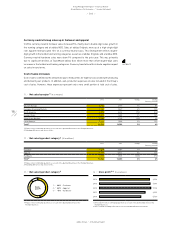
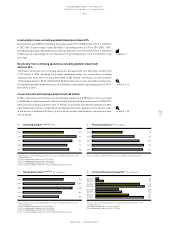
Quarterly development of Consumer Price Index 1)
(by region)
Q4 2013 Q1 2014 Q2 2014 Q3 2014 Q4 2014
USA 2) 1.5 1.5 2.1 1.7 0.8
Euro area 3) 0.8 0.5 0.5 0.3 (0.2)
Japan 4) 1.6 1.6 3.6 3.2 2.4
China 5) 2.5 2.4 2.3 1.6 1.5
Russia 6) 6.5 6.9 7.8 8.0 11.4
Brazil 7) 5.9 6.2 6.5 6.8 6.4
1) Quarter-end figures.
2) Source: US Bureau of Labor Statistics.
3) Source: Eurostat.
4) Source: Japan Ministry of Internal Affairs and Communications.
5) Source: China National Bureau of Statistics.
6) Source: Russia Federal Service of State Statistics.
7) Source: Brazil Institute of Geography and Statistics.
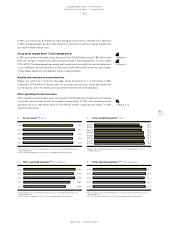
04
/
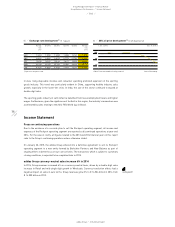
Quarterly consumer confidence development 1)
(by region)
Q4 2013 Q1 2014 Q2 2014 Q3 2014 Q4 2014
USA 2) 77.5 83.9 86.4 89.0 93.1
Euro area 3) (13.5) (9.3) (7.5) (11.4) (10.9)
Japan 4) 40.0 36.9 40.5 39.6 37.5
China 5) 102.3 107.9 104.7 105.4 105.8
Russia 6) (11.0) (11.0) (6.0) (7.0) (18.0)
Brazil 7) 111.2 108.8 106.3 109.7 109.2
1) Quarter-end figures.
2) Source: Conference Board.
3) Source: European Commission.
4) Source: Economic and Social Research Institute, Government of Japan.
5) Source: China National Bureau of Statistics.
6) Source: Russia Federal Service of State Statistics.
7) Source: Brazil National Confederation of Industry.
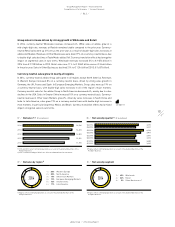
02
/
Quarterly unemployment rate by region 1)
(in % of total active population)
Q4 2013 Q1 2014 Q2 2014 Q3 2014 Q4 2014
USA 2) 7.0 6.6 6.2 6.1 5.7
Euro area 3) 11.8 11.7 11.5 11.5 11.4
Japan 4) 3.7 3.6 3.7 3.6 3.4
China 5) 4.1 4.1 4.1 4.1 4.1
Russia 6) 5.6 5.4 4.9 4.9 5.3
Brazil 7) 4.3 5.0 4.8 4.9 4.3
1) Quarter-end figures.
2) Source: US Bureau of Labor Statistics.
3) Source: Eurostat.
4) Source: Japan Ministry of Internal Affairs and Communications.
5) Source: China National Bureau of Statistics.
6) Source: Russia Federal Service of State Statistics.
7) Source: Brazil Institute of Geography and Statistics.
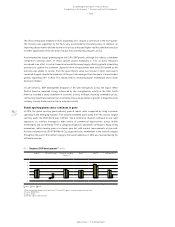
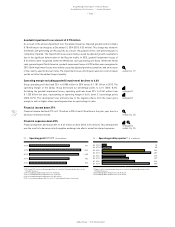
Western Europe saw a solid increase in the industry’s size, partly owing to the importance of
football and the large number of teams from this region that qualified for the 2014 FIFA World Cup.
Similarly, in many European emerging markets the significance of football and particularly Russia’s
participation in Brazil supported the sector’s expansion.
In North America, the sporting goods industry grew modestly. The strong performance of the US
team during the FIFA World Cup helped fuel strong football sales. Basketball footwear as well as
apparel continued to be in strong demand, outperforming casual footwear and outdoor products.
While the golf market was challenging through major parts of the year, as excess supply in retail
channels led to the continuation of a highly promotional environment, fewer overall product
launches led to a more healthy retail landscape and cleaner inventory levels at the end of the year.