Reebok 2014 Annual Report Download - page 134
Download and view the complete annual report
Please find page 134 of the 2014 Reebok annual report below. You can navigate through the pages in the report by either clicking on the pages listed below, or by using the keyword search tool below to find specific information within the annual report.-
 1
1 -
2
-
3
-
4
-
5
-
6
-
7
-
8
-
9
-
10
-
11
-
12
-
13
-
14
-
15
-
16
-
17
-
18
-
19
-
20
-
21
-
22
-
23
-
24
-
25
-
26
-
27
-
28
-
29
-
30
-
31
-
32
-
33
-
34
-
35
-
36
-
37
-
38
-
39
-
40
-
41
-
42
-
43
-
44
-
45
-
46
-
47
-
48
-
49
-
50
-
51
-
52
-
53
-
54
-
55
-
56
-
57
-
58
-
59
-
60
-
61
-
62
-
63
-
64
-
65
-
66
-
67
-
68
-
69
-
70
-
71
-
72
-
73
-
74
-
75
-
76
-
77
-
78
-
79
-
80
-
81
-
82
-
83
-
84
-
85
-
86
-
87
-
88
-
89
-
90
-
91
-
92
-
93
-
94
-
95
-
96
-
97
-
98
-
99
-
100
-
101
-
102
-
103
-
104
-
105
-
106
-
107
-
108
-
109
-
110
-
111
-
112
-
113
-
114
-
115
-
116
-
117
-
118
-
119
-
120
-
121
-
122
-
123
-
 124
124 -
 125
125 -
 126
126 -
 127
127 -
 128
128 -
 129
129 -
 130
130 -
 131
131 -
 132
132 -
 133
133 -
 134
134 -
 135
135 -
 136
136 -
 137
137 -
 138
138 -
 139
139 -
 140
140 -
 141
141 -
 142
142 -
 143
143 -
 144
144 -
145
-
146
-
147
-
148
-
149
-
150
-
151
-
152
-
153
-
154
-
155
-
156
-
157
-
158
-
159
-
160
-
161
-
162
-
163
-
164
-
165
-
166
-
167
-
168
-
169
-
170
-
171
-
172
-
173
-
174
-
175
-
176
-
177
-
178
-
179
-
180
-
181
-
182
-
183
-
184
-
185
-
186
-
187
-
188
-
189
-
190
-
191
-
192
-
193
-
194
-
195
-
196
-
197
-
198
-
199
-
200
-
201
-
202
-
203
-
204
-
205
-
206
-
207
-
208
-
209
-
210
-
211
-
212
-
213
-
214
-
215
-
216
-
217
-
218
-
219
-
220
-
221
-
222
-
223
-
224
-
225
-
226
-
227
-
228
-
229
-
230
-
231
-
232
-
233
-
234
-
235
-
236
-
237
-
238
-
239
-
240
-
241
-
242
-
243
-
244
-
245
-
246
-
247
-
248
-
249
-
250
-
251
-
252
-
253
-
254
-
255
-
256
-
257
-
258
-
259
-
260
-
261
-
262
-
263
-
264
-
265
-
266
-
267
-
268
 |
 |

130
2014
/
03.2
/
adidas Group
/
2014 Annual Report
Group Management Report – Financial Review
Group Business Performance
/
Financial Statements and Management Report of adidas AG
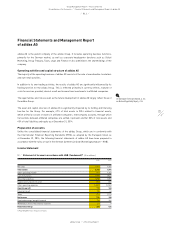
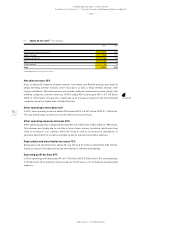
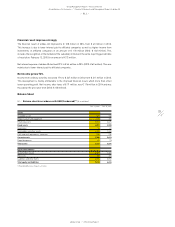
Total assets increase 11%
At the end of December 2014, total assets grew 11% to € 7.415 billion compared to € 6.694 billion in
the prior year. This was mainly a result of an increase in receivables and other assets in an amount
of € 384 million.
Shareholders’ equity decreases 18%
Shareholders’ equity declined 18% to € 2.051 billion at the end of December 2014 compared to
€ 2.489 billion in the prior year. This decrease was mainly due to the buyback of treasury shares and
lower retained earnings in 2014 compared to the prior year. Accordingly, the equity ratio declined
to 28%.
Provisions down 1%
Provisions decreased 1% to € 390 million at the end of 2014 (2013: € 393 million).
Liabilities and other items up 30%
Liabilities and other items increased 30% to € 4.974 billion at the end of 2014 (2013: € 3.812 billion).
This increase primarily resulted from the issuance of two Eurobonds with an overall volume of
€ 1 billion.
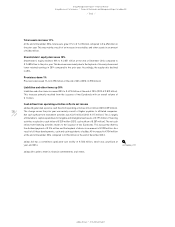
Cash inflow from operating activities reflects net income
adidas AG generated a positive cash flow from operating activities of € 61 million (2013: € 89 million).
The change versus the prior year was mainly a result of higher payables to affiliated companies.
Net cash outflow from investment activities was € 221 million (2013: € 115 million). This is largely
attributable to capital expenditure for tangible and intangible fixed assets of € 195 million. Financing
activities resulted in a cash inflow of € 359 million (2013: cash outflow of € 287 million). The net cash
inflow from financing activities relates to the issuance of two Eurobonds. This was partly offset by
the dividend payment of € 314 million and the buyback of shares in an amount of € 300 million. As a
result of all these developments, cash and cash equivalents of adidas AG increased to € 934 million
at the end of December 2014 compared to € 736 million at the end of December 2013.
adidas AG has a committed syndicated loan facility of € 500 million, which was unutilised at
year-end 2014.
adidas AG is able to meet its financial commitments at all times.
see Treasury, p. 121