Reebok 2014 Annual Report Download - page 146
Download and view the complete annual report
Please find page 146 of the 2014 Reebok annual report below. You can navigate through the pages in the report by either clicking on the pages listed below, or by using the keyword search tool below to find specific information within the annual report.-
 1
1 -
2
-
3
-
4
-
5
-
6
-
7
-
8
-
9
-
10
-
11
-
12
-
13
-
14
-
15
-
16
-
17
-
18
-
19
-
20
-
21
-
22
-
23
-
24
-
25
-
26
-
27
-
28
-
29
-
30
-
31
-
32
-
33
-
34
-
35
-
36
-
37
-
38
-
39
-
40
-
41
-
42
-
43
-
44
-
45
-
46
-
47
-
48
-
49
-
50
-
51
-
52
-
53
-
54
-
55
-
56
-
57
-
58
-
59
-
60
-
61
-
62
-
63
-
64
-
65
-
66
-
67
-
68
-
69
-
70
-
71
-
72
-
73
-
74
-
75
-
76
-
77
-
78
-
79
-
80
-
81
-
82
-
83
-
84
-
85
-
86
-
87
-
88
-
89
-
90
-
91
-
92
-
93
-
94
-
95
-
96
-
97
-
98
-
99
-
100
-
101
-
102
-
103
-
104
-
105
-
106
-
107
-
108
-
109
-
110
-
111
-
112
-
113
-
114
-
115
-
116
-
117
-
118
-
119
-
120
-
121
-
122
-
123
-
124
-
125
-
126
-
127
-
128
-
129
-
130
-
131
-
132
-
133
-
134
-
135
-
 136
136 -
 137
137 -
 138
138 -
 139
139 -
 140
140 -
 141
141 -
 142
142 -
 143
143 -
 144
144 -
 145
145 -
 146
146 -
 147
147 -
 148
148 -
 149
149 -
 150
150 -
 151
151 -
 152
152 -
 153
153 -
 154
154 -
 155
155 -
 156
156 -
157
-
158
-
159
-
160
-
161
-
162
-
163
-
164
-
165
-
166
-
167
-
168
-
169
-
170
-
171
-
172
-
173
-
174
-
175
-
176
-
177
-
178
-
179
-
180
-
181
-
182
-
183
-
184
-
185
-
186
-
187
-
188
-
189
-
190
-
191
-
192
-
193
-
194
-
195
-
196
-
197
-
198
-
199
-
200
-
201
-
202
-
203
-
204
-
205
-
206
-
207
-
208
-
209
-
210
-
211
-
212
-
213
-
214
-
215
-
216
-
217
-
218
-
219
-
220
-
221
-
222
-
223
-
224
-
225
-
226
-
227
-
228
-
229
-
230
-
231
-
232
-
233
-
234
-
235
-
236
-
237
-
238
-
239
-
240
-
241
-
242
-
243
-
244
-
245
-
246
-
247
-
248
-
249
-
250
-
251
-
252
-
253
-
254
-
255
-
256
-
257
-
258
-
259
-
260
-
261
-
262
-
263
-
264
-
265
-
266
-
267
-
268
 |
 |

142
2014
/
03.3
/
adidas Group
/
2014 Annual Report
Group Management Report – Financial Review
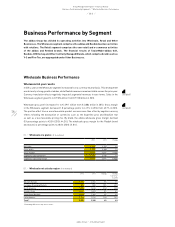
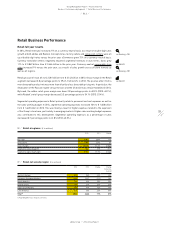
Business Performance by Segment
/
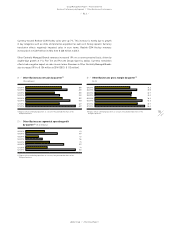
Retail Business Performance
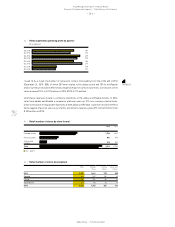
15
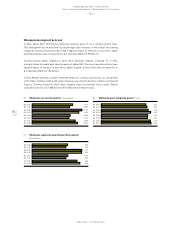
/
Retail number of stores by store format
2014 2013
Concept stores 1,746 1,661
Factory outlets 851 779
Concession
corners 316 300
Total 2,913 2,740
■ 2014 ■ 2013
16
/
Retail number of stores development
Total Concept
stores
Factory
outlets
Concession
corners
2013 2,740 1,661 779 300
Opened 409 251 126 32
Closed 236 166 54 16
Opened (net) 173 85 72 16
2014 2,913 1,746 851 316
14
/
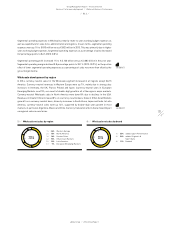
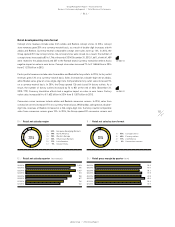
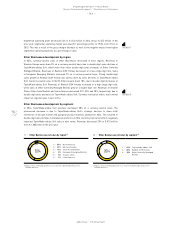
Retail segmental operating profit by quarter
(€ in millions)
Q4 2014 181
Q4 2013 166
Q3 2014 207
Q3 2013 195
Q2 2014 180
Q2 2013 216
Q1 2014 105
Q1 2013 101
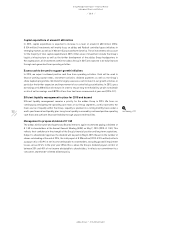
closed 16. As a result, the number of concession corners increased by 16 to 316 at the end of 2014
(December 31, 2013: 300), of which 207 were related to the adidas brand and 109 to the Reebok
brand. Currency translation effects had a negative impact on sales in euro terms. Concession corner
sales increased 15% to € 133 million in 2014 (2013: € 115 million).
eCommerce revenues include e-commerce operations of the adidas and Reebok brands. In 2014,
sales from adidas and Reebok e-commerce platforms were up 72% on a currency-neutral basis.
Sales increased at strong double-digit rates at both adidas and Reebok. Currency translation effects
had a negative impact on sales in euro terms. eCommerce revenues grew 69% to € 422 million from
€ 250 million in 2013.
see Table 16