Reebok 2014 Annual Report Download - page 75
Download and view the complete annual report
Please find page 75 of the 2014 Reebok annual report below. You can navigate through the pages in the report by either clicking on the pages listed below, or by using the keyword search tool below to find specific information within the annual report.-
 1
1 -
2
-
3
-
4
-
5
-
6
-
7
-
8
-
9
-
10
-
11
-
12
-
13
-
14
-
15
-
16
-
17
-
18
-
19
-
20
-
21
-
22
-
23
-
24
-
25
-
26
-
27
-
28
-
29
-
30
-
31
-
32
-
33
-
34
-
35
-
36
-
37
-
38
-
39
-
40
-
41
-
42
-
43
-
44
-
45
-
46
-
47
-
48
-
49
-
50
-
51
-
52
-
53
-
54
-
55
-
56
-
57
-
58
-
59
-
60
-
61
-
62
-
63
-
64
-
 65
65 -
 66
66 -
 67
67 -
 68
68 -
 69
69 -
 70
70 -
 71
71 -
 72
72 -
 73
73 -
 74
74 -
 75
75 -
 76
76 -
 77
77 -
 78
78 -
 79
79 -
 80
80 -
 81
81 -
 82
82 -
 83
83 -
 84
84 -
 85
85 -
86
-
87
-
88
-
89
-
90
-
91
-
92
-
93
-
94
-
95
-
96
-
97
-
98
-
99
-
100
-
101
-
102
-
103
-
104
-
105
-
106
-
107
-
108
-
109
-
110
-
111
-
112
-
113
-
114
-
115
-
116
-
117
-
118
-
119
-
120
-
121
-
122
-
123
-
124
-
125
-
126
-
127
-
128
-
129
-
130
-
131
-
132
-
133
-
134
-
135
-
136
-
137
-
138
-
139
-
140
-
141
-
142
-
143
-
144
-
145
-
146
-
147
-
148
-
149
-
150
-
151
-
152
-
153
-
154
-
155
-
156
-
157
-
158
-
159
-
160
-
161
-
162
-
163
-
164
-
165
-
166
-
167
-
168
-
169
-
170
-
171
-
172
-
173
-
174
-
175
-
176
-
177
-
178
-
179
-
180
-
181
-
182
-
183
-
184
-
185
-
186
-
187
-
188
-
189
-
190
-
191
-
192
-
193
-
194
-
195
-
196
-
197
-
198
-
199
-
200
-
201
-
202
-
203
-
204
-
205
-
206
-
207
-
208
-
209
-
210
-
211
-
212
-
213
-
214
-
215
-
216
-
217
-
218
-
219
-
220
-
221
-
222
-
223
-
224
-
225
-
226
-
227
-
228
-
229
-
230
-
231
-
232
-
233
-
234
-
235
-
236
-
237
-
238
-
239
-
240
-
241
-
242
-
243
-
244
-
245
-
246
-
247
-
248
-
249
-
250
-
251
-
252
-
253
-
254
-
255
-
256
-
257
-
258
-
259
-
260
-
261
-
262
-
263
-
264
-
265
-
266
-
267
-
268
 |
 |
adidas Group
/
2014 Annual Report
Group Management Report – Our Group
71
2014
Global Operations
/
02.5
/
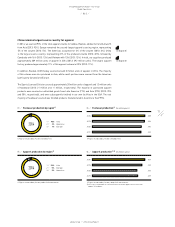
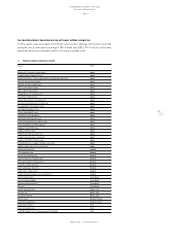
China remains largest source country for apparel
In 2014, we sourced 93% of the total apparel volume for adidas, Reebok, adidas Golf and Ashworth
from Asia (2013: 92%). Europe remained the second-largest apparel sourcing region, representing
5% of the volume (2013: 5%). The Americas accounted for 2% of the volume (2013: 3%). China
is the largest source country, representing 31% of the produced volume (2013: 32%), followed by
Cambodia with 16% (2013: 12%) and Vietnam with 13% (2013: 12%). In total, our suppliers produced
approximately 309 million units of apparel in 2014 (2013: 292 million units). The largest apparel
factory produced approximately 11% of this apparel volume in 2014 (2013: 11%).
In addition, Reebok-CCM Hockey sourced around 3 million units of apparel in 2014. The majority
of this volume was also produced in Asia, while small portions were sourced from the Americas
(particularly Canada) and Europe.
The Sports Licensed Division sourced approximately 20 million units of apparel and 12 million units
of headwear (2013: 21 million and 11 million, respectively). The majority of purchased apparel
products were sourced as unfinished goods from Latin America (71%) and Asia (29%) (2013: 70%
and 30%, respectively), and were subsequently finished in our own facilities in the USA. The vast
majority of headwear sourced was finished products manufactured in Asia (more than 99%).
see Diagram 05
see Diagram 06
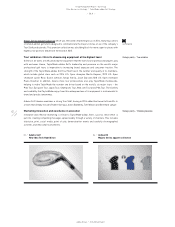
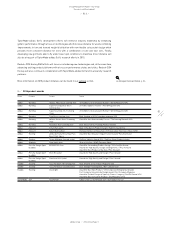
05
/
Apparel production by region 1)
1) Figures include adidas, Reebok, adidas Golf and Ashworth.
2014 1
/
93% Asia
2
/
5% Europe
3
/
2% Americas
1
2 3
06
/
Apparel production 1) 2) (in million units)
2014 309
2013 292
2012 262
2011 267
1) Figures include adidas, Reebok, adidas Golf and Ashworth.
2) 2011–2013 restated due to a reclassification of certain apparel accessories from
apparel to hardware.
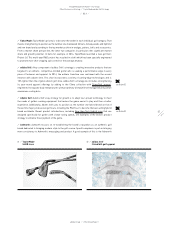
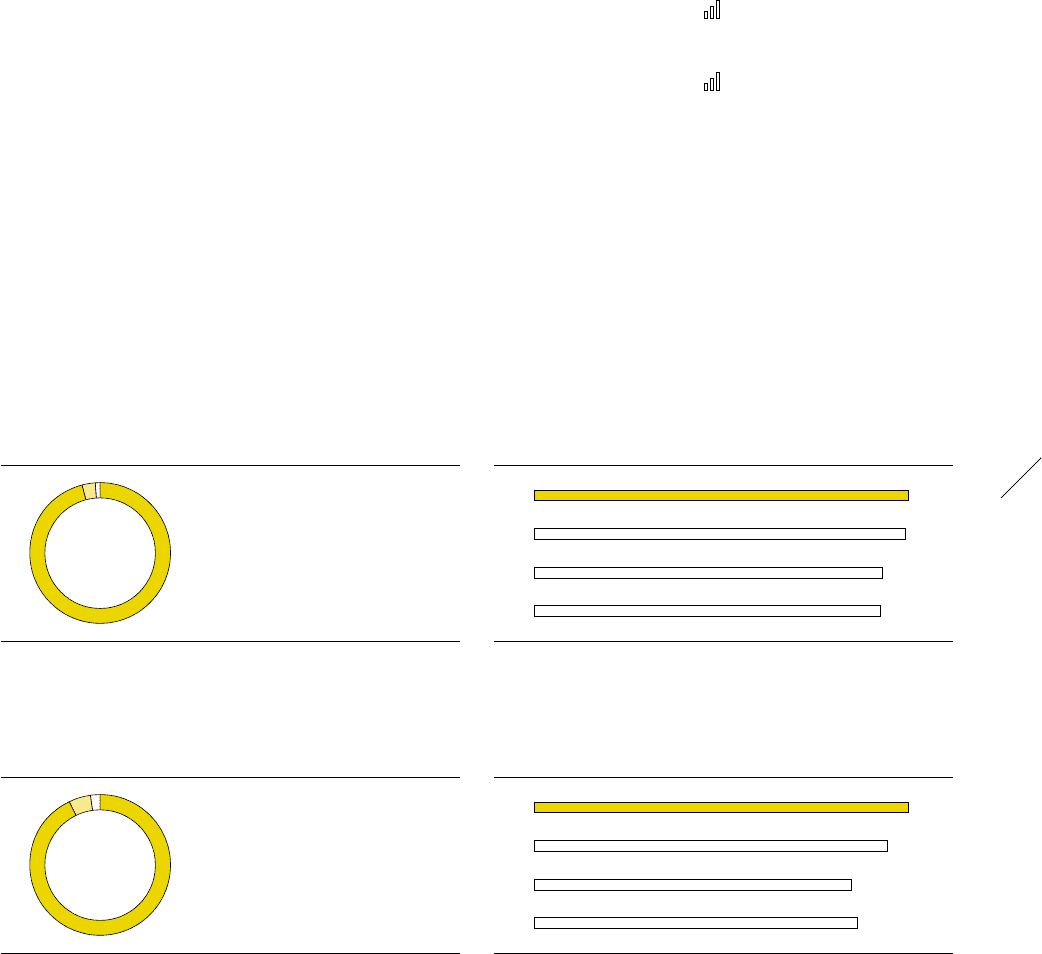
03
/
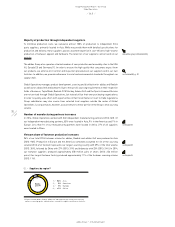
Footwear production by region 1)
1) Figures include adidas, Reebok and adidas Golf.
1
/
96% Asia
2
/
3% Americas
3
/
1% Europe
2014
1
2 3
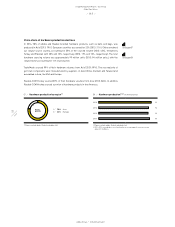
04
/
Footwear production 1) (in million pairs)
2014 258
2013 256
2012 240
2011 239
1) Figures include adidas, Reebok and adidas Golf.