Reebok 2014 Annual Report Download - page 144
Download and view the complete annual report
Please find page 144 of the 2014 Reebok annual report below. You can navigate through the pages in the report by either clicking on the pages listed below, or by using the keyword search tool below to find specific information within the annual report.-
 1
1 -
2
-
3
-
4
-
5
-
6
-
7
-
8
-
9
-
10
-
11
-
12
-
13
-
14
-
15
-
16
-
17
-
18
-
19
-
20
-
21
-
22
-
23
-
24
-
25
-
26
-
27
-
28
-
29
-
30
-
31
-
32
-
33
-
34
-
35
-
36
-
37
-
38
-
39
-
40
-
41
-
42
-
43
-
44
-
45
-
46
-
47
-
48
-
49
-
50
-
51
-
52
-
53
-
54
-
55
-
56
-
57
-
58
-
59
-
60
-
61
-
62
-
63
-
64
-
65
-
66
-
67
-
68
-
69
-
70
-
71
-
72
-
73
-
74
-
75
-
76
-
77
-
78
-
79
-
80
-
81
-
82
-
83
-
84
-
85
-
86
-
87
-
88
-
89
-
90
-
91
-
92
-
93
-
94
-
95
-
96
-
97
-
98
-
99
-
100
-
101
-
102
-
103
-
104
-
105
-
106
-
107
-
108
-
109
-
110
-
111
-
112
-
113
-
114
-
115
-
116
-
117
-
118
-
119
-
120
-
121
-
122
-
123
-
124
-
125
-
126
-
127
-
128
-
129
-
130
-
131
-
132
-
133
-
 134
134 -
 135
135 -
 136
136 -
 137
137 -
 138
138 -
 139
139 -
 140
140 -
 141
141 -
 142
142 -
 143
143 -
 144
144 -
 145
145 -
 146
146 -
 147
147 -
 148
148 -
 149
149 -
 150
150 -
 151
151 -
 152
152 -
 153
153 -
 154
154 -
155
-
156
-
157
-
158
-
159
-
160
-
161
-
162
-
163
-
164
-
165
-
166
-
167
-
168
-
169
-
170
-
171
-
172
-
173
-
174
-
175
-
176
-
177
-
178
-
179
-
180
-
181
-
182
-
183
-
184
-
185
-
186
-
187
-
188
-
189
-
190
-
191
-
192
-
193
-
194
-
195
-
196
-
197
-
198
-
199
-
200
-
201
-
202
-
203
-
204
-
205
-
206
-
207
-
208
-
209
-
210
-
211
-
212
-
213
-
214
-
215
-
216
-
217
-
218
-
219
-
220
-
221
-
222
-
223
-
224
-
225
-
226
-
227
-
228
-
229
-
230
-
231
-
232
-
233
-
234
-
235
-
236
-
237
-
238
-
239
-
240
-
241
-
242
-
243
-
244
-
245
-
246
-
247
-
248
-
249
-
250
-
251
-
252
-
253
-
254
-
255
-
256
-
257
-
258
-
259
-
260
-
261
-
262
-
263
-
264
-
265
-
266
-
267
-
268
 |
 |

140
2014
/
03.3
/
adidas Group
/
2014 Annual Report
Group Management Report – Financial Review
Business Performance by Segment
/
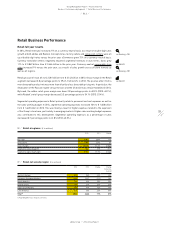
Retail Business Performance
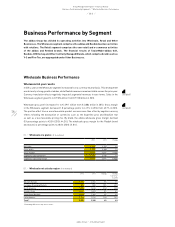
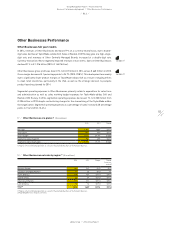
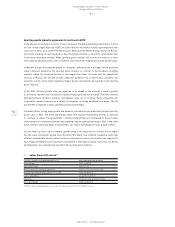
Segmental operating profit decreased 1% to € 673 million in 2014 versus € 678 million in the prior
year. Segmental operating margin declined 2.1 percentage points to 17.5% (2013: 19.7%), as the
positive effects of lower segmental operating expenses as a percentage of sales were more than
offset by the decline in gross margin.
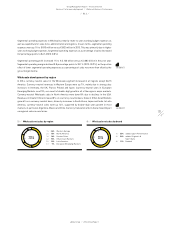
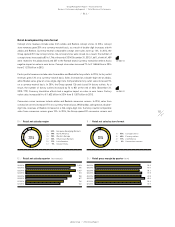
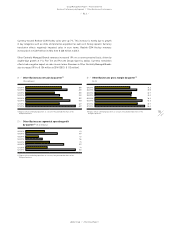
Retail development by region
Currency-neutral Retail sales increased at a double-digit rate in all regions. Retail revenues in
Western Europe grew 23% on a currency-neutral basis, mainly due to double-digit sales increases in
the UK, France, Germany and Spain. Sales in European Emerging Markets rose 18% on a currency-
neutral basis, as a result of double-digit growth in all markets. Currency-neutral Retail sales in
North America grew 15%, due to double-digit growth in both the USA and Canada. Retail revenues
in Greater China increased 26% on a currency-neutral basis. Sales in Other Asian Markets grew
19% on a currency-neutral basis, driven by double-digit growth in Japan and South Korea. In Latin
America, currency-neutral Retail sales grew 39%, with double-digit sales increases in all markets,
in particular in Argentina, Colombia and Brazil. Currency translation effects had a mixed impact on
regional sales in euro terms.
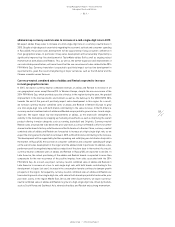
Retail development by brand
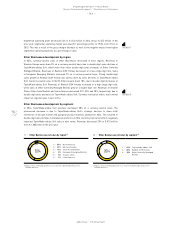
In 2014, adidas Group Retail sales increased at a double-digit rate at both adidas and Reebok.
Currency-neutral adidas Sport Performance revenues grew 22% in the period, mainly due to double-
digit growth in the football, training and running categories. adidas Originals & Sport Style sales
also rose 22% on a currency-neutral basis, driven by double-digit sales increases at both adidas
Originals and adidas NEO. Currency-neutral Reebok sales were 14% higher compared to the prior
year, driven by double-digit growth in the fitness training and Classics categories. Comparable store
sales for the adidas brand increased 10% on a currency-neutral basis, while Reebok comparable
store sales grew 1% on a currency-neutral basis. Currency translation effects had a negative
impact on revenues in euro terms. adidas Sport Performance own-retail sales increased 13% to
€ 2.112 billion in 2014 from € 1.875 billion in 2013. adidas Originals & Sport Style own-retail sales
were also up 13% to € 1.153 billion from € 1.020 billion in 2013. Own-retail sales of Reebok branded
products grew 5% to € 578 million (2013: € 549 million).
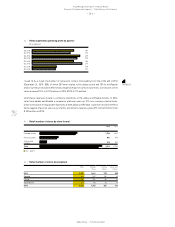
Retail store development
At December 31, 2014, the adidas Group Retail segment operated 2,913 stores compared to the
prior year-end level of 2,740. This represents a net increase of 173 stores. Of the total number of
stores, 1,616 were adidas and 446 were Reebok branded (December 31, 2013: 1,557 adidas stores,
404 Reebok stores). In addition, the adidas Group Retail segment operated 851 factory outlets
(December 31, 2013: 779). During 2014, the Group opened 409 new stores, 236 stores were closed
and 145 stores were remodelled.
see Table 08
see Table 09