Reebok 2014 Annual Report Download - page 118
Download and view the complete annual report
Please find page 118 of the 2014 Reebok annual report below. You can navigate through the pages in the report by either clicking on the pages listed below, or by using the keyword search tool below to find specific information within the annual report.-
 1
1 -
2
-
3
-
4
-
5
-
6
-
7
-
8
-
9
-
10
-
11
-
12
-
13
-
14
-
15
-
16
-
17
-
18
-
19
-
20
-
21
-
22
-
23
-
24
-
25
-
26
-
27
-
28
-
29
-
30
-
31
-
32
-
33
-
34
-
35
-
36
-
37
-
38
-
39
-
40
-
41
-
42
-
43
-
44
-
45
-
46
-
47
-
48
-
49
-
50
-
51
-
52
-
53
-
54
-
55
-
56
-
57
-
58
-
59
-
60
-
61
-
62
-
63
-
64
-
65
-
66
-
67
-
68
-
69
-
70
-
71
-
72
-
73
-
74
-
75
-
76
-
77
-
78
-
79
-
80
-
81
-
82
-
83
-
84
-
85
-
86
-
87
-
88
-
89
-
90
-
91
-
92
-
93
-
94
-
95
-
96
-
97
-
98
-
99
-
100
-
101
-
102
-
103
-
104
-
105
-
106
-
107
-
 108
108 -
 109
109 -
 110
110 -
 111
111 -
 112
112 -
 113
113 -
 114
114 -
 115
115 -
 116
116 -
 117
117 -
 118
118 -
 119
119 -
 120
120 -
 121
121 -
 122
122 -
 123
123 -
 124
124 -
 125
125 -
 126
126 -
 127
127 -
 128
128 -
129
-
130
-
131
-
132
-
133
-
134
-
135
-
136
-
137
-
138
-
139
-
140
-
141
-
142
-
143
-
144
-
145
-
146
-
147
-
148
-
149
-
150
-
151
-
152
-
153
-
154
-
155
-
156
-
157
-
158
-
159
-
160
-
161
-
162
-
163
-
164
-
165
-
166
-
167
-
168
-
169
-
170
-
171
-
172
-
173
-
174
-
175
-
176
-
177
-
178
-
179
-
180
-
181
-
182
-
183
-
184
-
185
-
186
-
187
-
188
-
189
-
190
-
191
-
192
-
193
-
194
-
195
-
196
-
197
-
198
-
199
-
200
-
201
-
202
-
203
-
204
-
205
-
206
-
207
-
208
-
209
-
210
-
211
-
212
-
213
-
214
-
215
-
216
-
217
-
218
-
219
-
220
-
221
-
222
-
223
-
224
-
225
-
226
-
227
-
228
-
229
-
230
-
231
-
232
-
233
-
234
-
235
-
236
-
237
-
238
-
239
-
240
-
241
-
242
-
243
-
244
-
245
-
246
-
247
-
248
-
249
-
250
-
251
-
252
-
253
-
254
-
255
-
256
-
257
-
258
-
259
-
260
-
261
-
262
-
263
-
264
-
265
-
266
-
267
-
268
 |
 |
114
2014
/
03.2
/
adidas Group
/
2014 Annual Report
Group Management Report – Financial Review
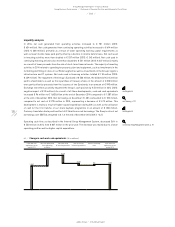
Group Business Performance
/
Income Statement
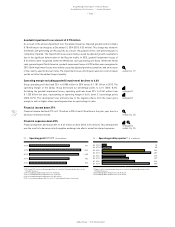
Net income attributable to shareholders excluding goodwill impairment
down 32%
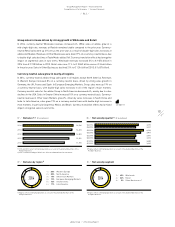
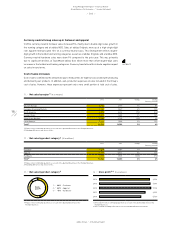
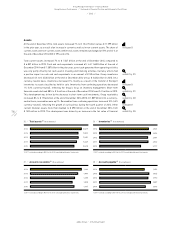
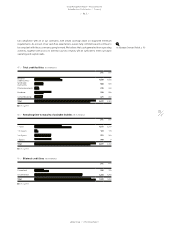
The Group’s net income attributable to shareholders, which in addition to net income from continuing
operations includes net income from discontinued operations, decreased to € 490 million in 2014
from € 787 million in 2013. This represents a decline of 38% versus the prior year level. Excluding
the goodwill impairment losses, net income attributable to shareholders decreased 32% to
€ 568 million (2013: € 839 million).
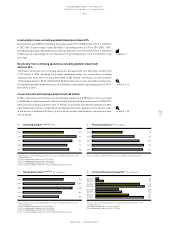
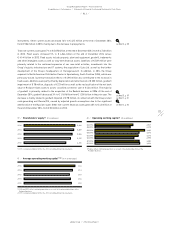
Earnings per share from continuing and discontinued operations excluding
goodwill impairment reach € 2.72
Basic and diluted earnings per share (EPS) from continuing operations declined 27% to € 2.67 in
2014 (2013: € 3.68). Excluding the goodwill impairment losses, basic and diluted EPS from continuing
operations decreased 22% to € 3.05 last year from € 3.93 in 2013. The Group’s basic and diluted EPS
from continuing and discontinued operations amounted to € 2.35 (2013: € 3.76), representing a
decrease of 37%. Excluding goodwill impairment losses, basic and diluted EPS from continuing and
discontinued operations were down 32% to € 2.72 (2013: € 4.01). The weighted average number of
shares used in the calculation was 208,776,457 (2013: 209,216,186).
see Diagram 29
see Diagram 31
see Note 35, p. 238
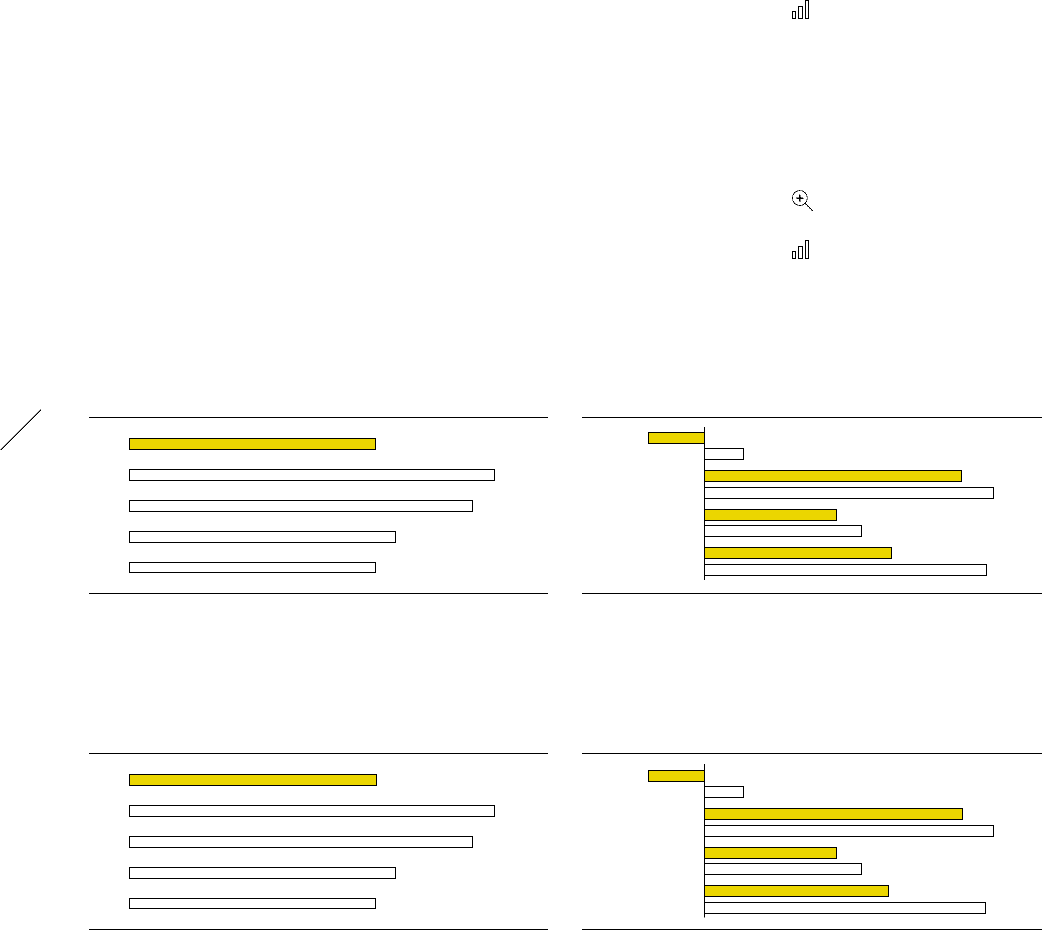
31
/
Diluted earnings per share 1) 2) 3) 4) 5) (in €)
2014 2.72
2013 4.01
2012 3.78
2011 2.93
2010 2.71
1) Includes continuing and discontinued operations.
2) 2014 exluding goodwill impairment of € 78 million.
3) 2013 excluding goodwill impairment of € 52 million.
4) 2012 excluding goodwill impairment of € 265 million.
5) 2011 restated according to IAS 8 in the 2012 consolidated financial statements.
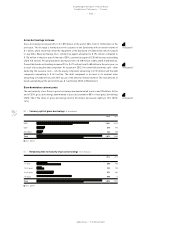
29
/
Net income attributable to shareholders 1) 2) 3) 4) 5)
(€ in millions)
2014 568
2013 839
2012 791
2011 613
2010 567
1) Includes continuing and discontinued operations.
2) 2014 exluding goodwill impairment of € 78 million.
3) 2013 excluding goodwill impairment of € 52 million.
4) 2012 excluding goodwill impairment of € 265 million.
5) 2011 restated according to IAS 8 in the 2012 consolidated financial statements.
30
/
Net income attributable to shareholders by quarter 1)
(€ in millions)
Q4 2014 2) (62)
Q4 2013 3) 42
Q3 2014 282
Q3 2013 316
Q2 2014 144
Q2 2013 172
Q1 2014 204
Q1 2013 308
1) Includes continuing and discontinued operations.
2) Excluding goodwill impairment of € 78 million.
3) Excluding goodwill impairment of € 52 million.
32
/
Diluted earnings per share by quarter 1) (in €)
Q4 2014 2) (0.30)
Q4 2013 3) 0.20
Q3 2014 1.35
Q3 2013 1.51
Q2 2014 0.69
Q2 2013 0.82
Q1 2014 4) 0.96
Q1 2013 1.47
1) Includes continuing and discontinued operations.
2) Excluding goodwill impairment of € 78 million.
3) Excluding goodwill impairment of € 52 million.
4) Weighted average number of shares: 215,233,140.