Reebok 2014 Annual Report Download - page 117
Download and view the complete annual report
Please find page 117 of the 2014 Reebok annual report below. You can navigate through the pages in the report by either clicking on the pages listed below, or by using the keyword search tool below to find specific information within the annual report.-
 1
1 -
2
-
3
-
4
-
5
-
6
-
7
-
8
-
9
-
10
-
11
-
12
-
13
-
14
-
15
-
16
-
17
-
18
-
19
-
20
-
21
-
22
-
23
-
24
-
25
-
26
-
27
-
28
-
29
-
30
-
31
-
32
-
33
-
34
-
35
-
36
-
37
-
38
-
39
-
40
-
41
-
42
-
43
-
44
-
45
-
46
-
47
-
48
-
49
-
50
-
51
-
52
-
53
-
54
-
55
-
56
-
57
-
58
-
59
-
60
-
61
-
62
-
63
-
64
-
65
-
66
-
67
-
68
-
69
-
70
-
71
-
72
-
73
-
74
-
75
-
76
-
77
-
78
-
79
-
80
-
81
-
82
-
83
-
84
-
85
-
86
-
87
-
88
-
89
-
90
-
91
-
92
-
93
-
94
-
95
-
96
-
97
-
98
-
99
-
100
-
101
-
102
-
103
-
104
-
105
-
106
-
 107
107 -
 108
108 -
 109
109 -
 110
110 -
 111
111 -
 112
112 -
 113
113 -
 114
114 -
 115
115 -
 116
116 -
 117
117 -
 118
118 -
 119
119 -
 120
120 -
 121
121 -
 122
122 -
 123
123 -
 124
124 -
 125
125 -
 126
126 -
 127
127 -
128
-
129
-
130
-
131
-
132
-
133
-
134
-
135
-
136
-
137
-
138
-
139
-
140
-
141
-
142
-
143
-
144
-
145
-
146
-
147
-
148
-
149
-
150
-
151
-
152
-
153
-
154
-
155
-
156
-
157
-
158
-
159
-
160
-
161
-
162
-
163
-
164
-
165
-
166
-
167
-
168
-
169
-
170
-
171
-
172
-
173
-
174
-
175
-
176
-
177
-
178
-
179
-
180
-
181
-
182
-
183
-
184
-
185
-
186
-
187
-
188
-
189
-
190
-
191
-
192
-
193
-
194
-
195
-
196
-
197
-
198
-
199
-
200
-
201
-
202
-
203
-
204
-
205
-
206
-
207
-
208
-
209
-
210
-
211
-
212
-
213
-
214
-
215
-
216
-
217
-
218
-
219
-
220
-
221
-
222
-
223
-
224
-
225
-
226
-
227
-
228
-
229
-
230
-
231
-
232
-
233
-
234
-
235
-
236
-
237
-
238
-
239
-
240
-
241
-
242
-
243
-
244
-
245
-
246
-
247
-
248
-
249
-
250
-
251
-
252
-
253
-
254
-
255
-
256
-
257
-
258
-
259
-
260
-
261
-
262
-
263
-
264
-
265
-
266
-
267
-
268
 |
 |
Group Management Report – Financial Review
113
2014
/
03.2
/
adidas Group
/
2014 Annual Report
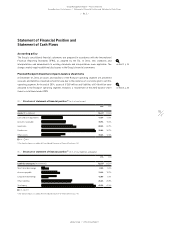
Group Business Performance
/
Income Statement
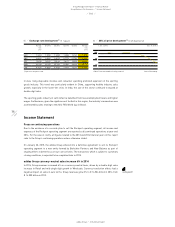
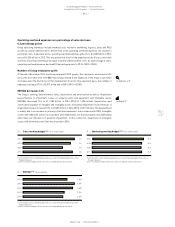
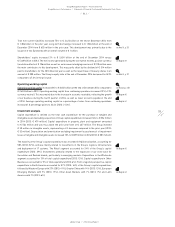
Income before taxes excluding goodwill impairment down 22%
Income before taxes (IBT) for the adidas Group decreased 25% to € 835 million from € 1.113 billion
in 2013. IBT as a percentage of sales declined 2.1 percentage points to 5.7% in 2014 (2013: 7.8%).
Excluding the goodwill impairment losses, IBT was down 22% to € 913 million from € 1.165 billion
in 2013 and, as a percentage of sales, decreased 1.9 percentage points to 6.3 % from 8.2% in the
prior year.
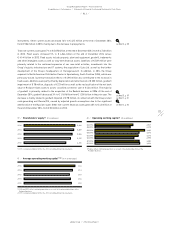
Net income from continuing operations excluding goodwill impairment
declines 22%
The Group’s net income from continuing operations decreased 27% to € 564 million in 2014 from
€ 773 million in 2013. Excluding the goodwill impairment losses, net income from continuing
operations was down 22% to € 642 million (2013: € 825 million). The Group’s tax rate increased
1.9 percentage points to 32.5% in 2014 (2013: 30.5%), mainly due to a less favourable earnings mix.
Excluding the goodwill impairment losses, the effective tax rate grew 0.5 percentage points to 29.7%
from 29.2% in 2013.
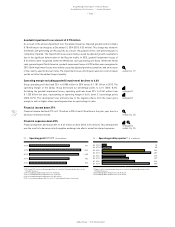
Losses from discontinued operations total € 68 million
In 2014, the Group incurred losses from discontinued operations of € 68 million, net of tax, related
to the Rockport operating segment, which is planned to be divested during the course of 2015 (2013:
gains from discontinued operations of € 17 million). Losses from discontinued operations in 2014
were mainly due to the loss recognised on the measurement to fair value less cost to sell, net of tax,
in the amount of negative € 82 million, partly offset by income from Rockport’s operating activities
of € 14 million.
see Diagram 27
see Note 34, p. 236
see Note 03, p. 206
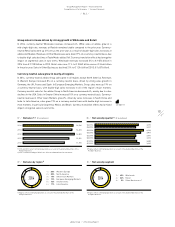
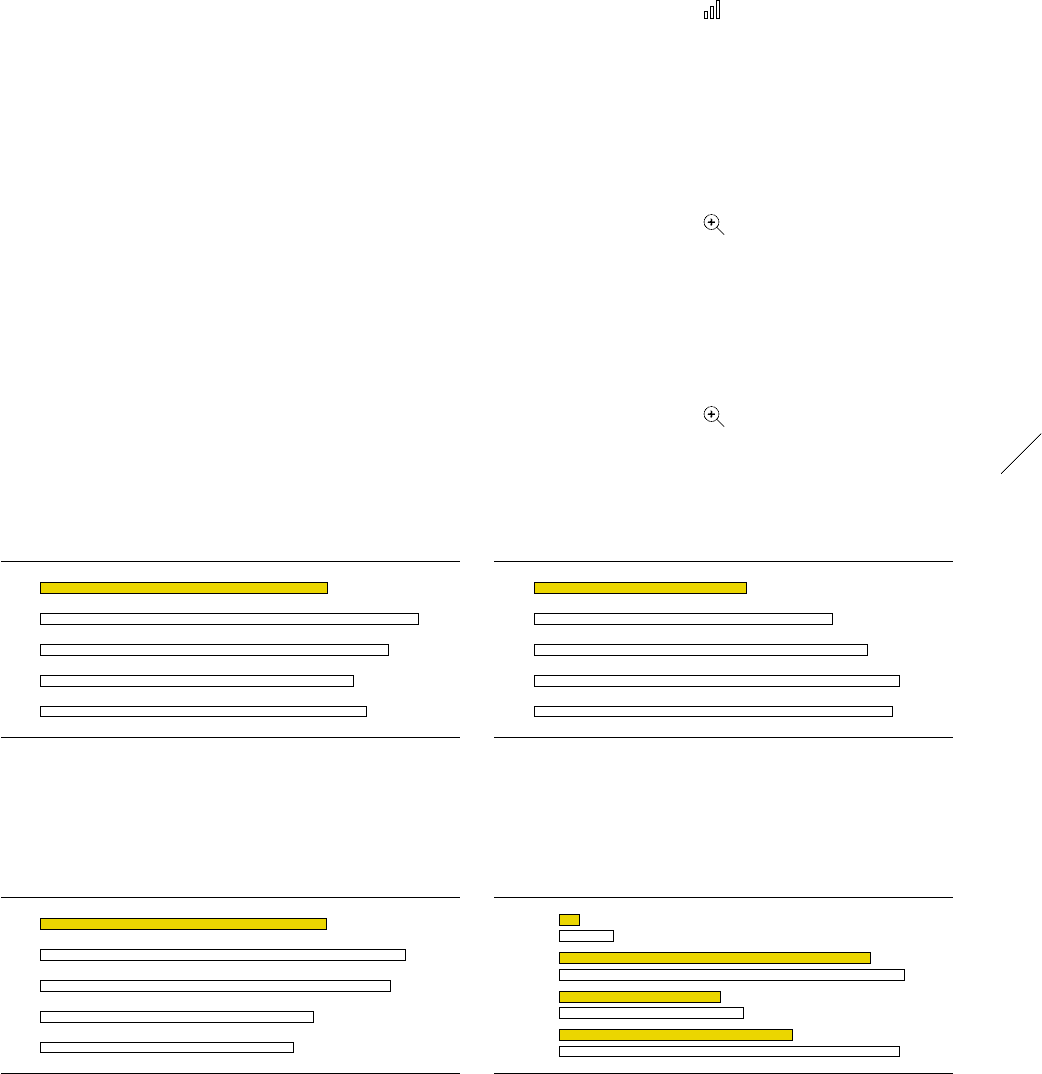
25
/
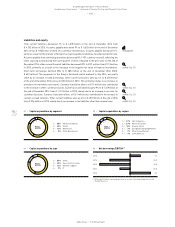
Operating margin 1) 2) 3) 4) 5) (in %)
2014 6.6
2013 8.7
2012 8.0
2011 7.2
2010 7.5
1) 2014 and 2013 reflect continuing operations as a result of the planned divestiture of the
Rockport business.
2) 2014 exluding goodwill impairment of € 78 million.
3) 2013 excluding goodwill impairment of € 52 million.
4) 2012 excluding goodwill impairment of € 265 million.
5) 2011 restated according to IAS 8 in the 2012 consolidated financial statements.
26
/
Financial expenses 1) (€ in millions)
2014 67
2013 94
2012 105
2011 115
2010 113
1) 2011 restated according to IAS 8 in the 2012 consolidated financial statements.
27
/
Income before taxes 1) 2) 3) 4) 5) (€ in millions)
2014 913
2013 1,165
2012 1,116
2011 869
2010 806
1) 2014 and 2013 reflect continuing operations as a result of the planned divestiture of the
Rockport business.
2) 2014 exluding goodwill impairment of € 78 million.
3) 2013 excluding goodwill impairment of € 52 million.
4) 2012 excluding goodwill impairment of € 265 million.
5) 2011 restated according to IAS 8 in the 2012 consolidated financial statements.
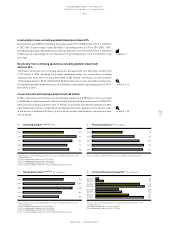
28
/
Income before taxes by quarter 1) (€ in millions)
Q4 2014 2) 25
Q4 2013 3) 68
Q3 2014 392
Q3 2013 436
Q2 2014 203
Q2 2013 232
Q1 2014 294
Q1 2013 430
1) Figures reflect continuing operations as a result of the planned divestiture of the
Rockport business.
2) Excluding goodwill impairment of € 78 million.
3) Excluding goodwill impairment of € 52 million.