Reebok 2014 Annual Report Download - page 110
Download and view the complete annual report
Please find page 110 of the 2014 Reebok annual report below. You can navigate through the pages in the report by either clicking on the pages listed below, or by using the keyword search tool below to find specific information within the annual report.-
 1
1 -
2
-
3
-
4
-
5
-
6
-
7
-
8
-
9
-
10
-
11
-
12
-
13
-
14
-
15
-
16
-
17
-
18
-
19
-
20
-
21
-
22
-
23
-
24
-
25
-
26
-
27
-
28
-
29
-
30
-
31
-
32
-
33
-
34
-
35
-
36
-
37
-
38
-
39
-
40
-
41
-
42
-
43
-
44
-
45
-
46
-
47
-
48
-
49
-
50
-
51
-
52
-
53
-
54
-
55
-
56
-
57
-
58
-
59
-
60
-
61
-
62
-
63
-
64
-
65
-
66
-
67
-
68
-
69
-
70
-
71
-
72
-
73
-
74
-
75
-
76
-
77
-
78
-
79
-
80
-
81
-
82
-
83
-
84
-
85
-
86
-
87
-
88
-
89
-
90
-
91
-
92
-
93
-
94
-
95
-
96
-
97
-
98
-
99
-
 100
100 -
 101
101 -
 102
102 -
 103
103 -
 104
104 -
 105
105 -
 106
106 -
 107
107 -
 108
108 -
 109
109 -
 110
110 -
 111
111 -
 112
112 -
 113
113 -
 114
114 -
 115
115 -
 116
116 -
 117
117 -
 118
118 -
 119
119 -
 120
120 -
121
-
122
-
123
-
124
-
125
-
126
-
127
-
128
-
129
-
130
-
131
-
132
-
133
-
134
-
135
-
136
-
137
-
138
-
139
-
140
-
141
-
142
-
143
-
144
-
145
-
146
-
147
-
148
-
149
-
150
-
151
-
152
-
153
-
154
-
155
-
156
-
157
-
158
-
159
-
160
-
161
-
162
-
163
-
164
-
165
-
166
-
167
-
168
-
169
-
170
-
171
-
172
-
173
-
174
-
175
-
176
-
177
-
178
-
179
-
180
-
181
-
182
-
183
-
184
-
185
-
186
-
187
-
188
-
189
-
190
-
191
-
192
-
193
-
194
-
195
-
196
-
197
-
198
-
199
-
200
-
201
-
202
-
203
-
204
-
205
-
206
-
207
-
208
-
209
-
210
-
211
-
212
-
213
-
214
-
215
-
216
-
217
-
218
-
219
-
220
-
221
-
222
-
223
-
224
-
225
-
226
-
227
-
228
-
229
-
230
-
231
-
232
-
233
-
234
-
235
-
236
-
237
-
238
-
239
-
240
-
241
-
242
-
243
-
244
-
245
-
246
-
247
-
248
-
249
-
250
-
251
-
252
-
253
-
254
-
255
-
256
-
257
-
258
-
259
-
260
-
261
-
262
-
263
-
264
-
265
-
266
-
267
-
268
 |
 |
106
2014
/
03.2
/
adidas Group
/
2014 Annual Report
Group Management Report – Financial Review
Group Business Performance
/
Income Statement
In Asia, rising disposable incomes and consumer spending promoted expansion of the sporting
goods industry. This trend was particularly evident in China, supporting healthy industry sales
growth, especially in the lower-tier cities. In India, the size of the sector continued to expand at
double-digit rates.
The sporting goods industry in Latin America benefited from low unemployment levels and higher
wages. Furthermore, given the significance of football in this region, the industry’s momentum was
accelerated by sales relating to the 2014 FIFA World Cup in Brazil.
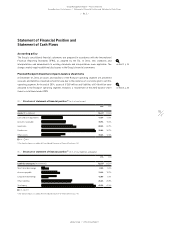
Income Statement
Focus on continuing operations
Due to the existence of a concrete plan to sell the Rockport operating segment, all income and
expenses of the Rockport operating segment are reported as discontinued operations at year-end
2014. For the sake of clarity, all figures related to the 2013 and 2014 financial years in this report
refer to the Group’s continuing operations unless otherwise stated.
On January 23, 2015, the adidas Group entered into a definitive agreement to sell its Rockport
operating segment to a new entity formed by Berkshire Partners and New Balance as part of
ongoing efforts to better focus on our core activities. The transaction, which is subject to customary
closing conditions, is expected to be completed later in 2015.
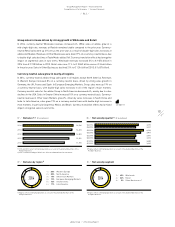
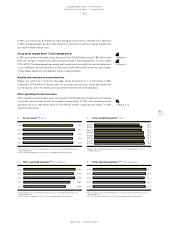
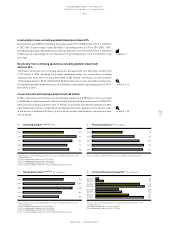
adidas Group currency-neutral sales increase 6% in 2014
In 2014, Group revenues increased 6% on a currency-neutral basis, driven by a double-digit sales
increase in Retail and mid-single-digit growth in Wholesale. Currency translation effects had a
negative impact on sales in euro terms. Group revenues grew 2% to € 14.534 billion in 2014 from
€ 14.203 billion in 2013.
see Diagram 07
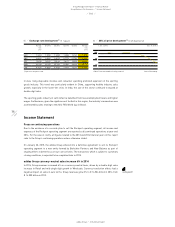
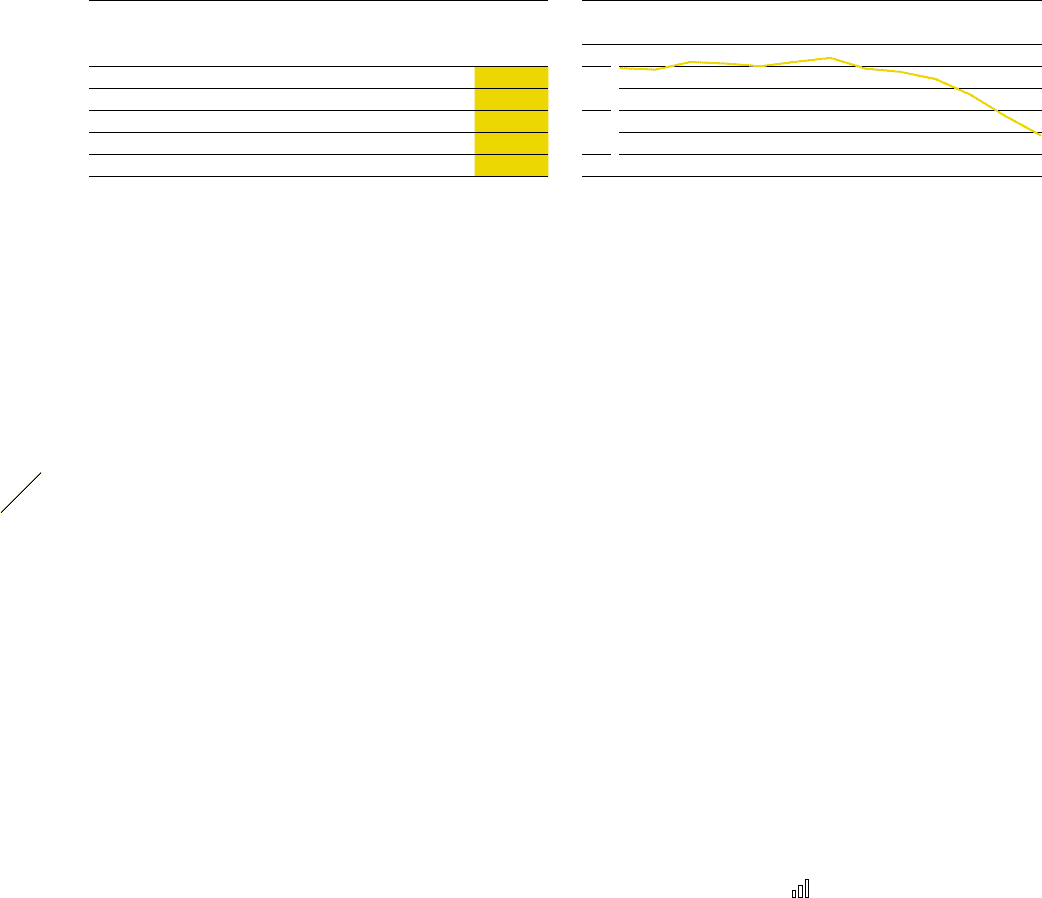
06
/
2014 oil price development 1) (in US $ per barrel)
| Jan. 1, 2014 Dec. 31, 2014 |
100
70
40
1) West Texas Intermediate Cushing crude oil. Source: Bloomberg.
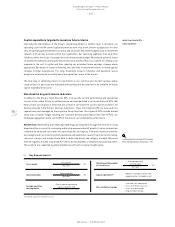
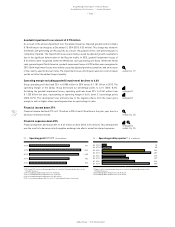
05
/
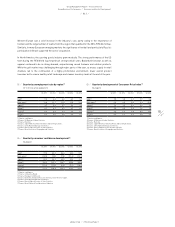
Exchange rate development 1) (€ 1 equals)
Average
rate
2013
Q1 2014 Q2 2014 Q3 2014 Q4 2014 Average
rate
2014
USD 1.3283 1.3788 1.3658 1.2583 1.2141 1.3296
GBP 0.8492 0.8282 0.8015 0.7773 0.7789 0.8066
JPY 129.58 142.42 138.44 138.11 145.23 140.44
RUB 42.298 49.205 45.933 49.560 68.303 50.737
CNY 8.1674 8.4825 8.4035 7.7417 7.4291 8.1919
1) Spot rates at quarter-end.