Reebok 2014 Annual Report Download - page 175
Download and view the complete annual report
Please find page 175 of the 2014 Reebok annual report below. You can navigate through the pages in the report by either clicking on the pages listed below, or by using the keyword search tool below to find specific information within the annual report.-
 1
1 -
2
-
3
-
4
-
5
-
6
-
7
-
8
-
9
-
10
-
11
-
12
-
13
-
14
-
15
-
16
-
17
-
18
-
19
-
20
-
21
-
22
-
23
-
24
-
25
-
26
-
27
-
28
-
29
-
30
-
31
-
32
-
33
-
34
-
35
-
36
-
37
-
38
-
39
-
40
-
41
-
42
-
43
-
44
-
45
-
46
-
47
-
48
-
49
-
50
-
51
-
52
-
53
-
54
-
55
-
56
-
57
-
58
-
59
-
60
-
61
-
62
-
63
-
64
-
65
-
66
-
67
-
68
-
69
-
70
-
71
-
72
-
73
-
74
-
75
-
76
-
77
-
78
-
79
-
80
-
81
-
82
-
83
-
84
-
85
-
86
-
87
-
88
-
89
-
90
-
91
-
92
-
93
-
94
-
95
-
96
-
97
-
98
-
99
-
100
-
101
-
102
-
103
-
104
-
105
-
106
-
107
-
108
-
109
-
110
-
111
-
112
-
113
-
114
-
115
-
116
-
117
-
118
-
119
-
120
-
121
-
122
-
123
-
124
-
125
-
126
-
127
-
128
-
129
-
130
-
131
-
132
-
133
-
134
-
135
-
136
-
137
-
138
-
139
-
140
-
141
-
142
-
143
-
144
-
145
-
146
-
147
-
148
-
149
-
150
-
151
-
152
-
153
-
154
-
155
-
156
-
157
-
158
-
159
-
160
-
161
-
162
-
163
-
164
-
 165
165 -
 166
166 -
 167
167 -
 168
168 -
 169
169 -
 170
170 -
 171
171 -
 172
172 -
 173
173 -
 174
174 -
 175
175 -
 176
176 -
 177
177 -
 178
178 -
 179
179 -
 180
180 -
 181
181 -
 182
182 -
 183
183 -
 184
184 -
 185
185 -
186
-
187
-
188
-
189
-
190
-
191
-
192
-
193
-
194
-
195
-
196
-
197
-
198
-
199
-
200
-
201
-
202
-
203
-
204
-
205
-
206
-
207
-
208
-
209
-
210
-
211
-
212
-
213
-
214
-
215
-
216
-
217
-
218
-
219
-
220
-
221
-
222
-
223
-
224
-
225
-
226
-
227
-
228
-
229
-
230
-
231
-
232
-
233
-
234
-
235
-
236
-
237
-
238
-
239
-
240
-
241
-
242
-
243
-
244
-
245
-
246
-
247
-
248
-
249
-
250
-
251
-
252
-
253
-
254
-
255
-
256
-
257
-
258
-
259
-
260
-
261
-
262
-
263
-
264
-
265
-
266
-
267
-
268
 |
 |

Group Management Report – Financial Review
171
2014
/
03.5
/
adidas Group
/
2014 Annual Report
Risk and Opportunity Report
/
Financial Risks
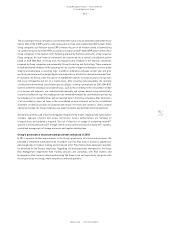
Risks related to product counterfeiting and imitation
As popular consumer brands which rely on technological and design innovation as defining
characteristics, the Group’s brands are frequent targets for counterfeiting and imitation. To reduce
the loss of sales and the potential damage to brand reputation resulting from counterfeit products,
the adidas Group makes use of extensive legal protection (generally through registration) and works
closely with law enforcement authorities, investigators and external legal counsel. Although we
have stepped up measures such as product security labelling with our authorised suppliers, the
development of these measures remains a key priority on an ongoing basis. In 2014, around twelve
million counterfeit adidas Group products were seized worldwide (2013: ten million).
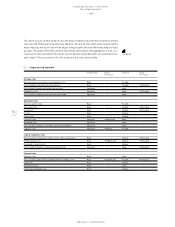
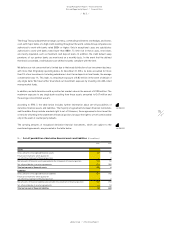
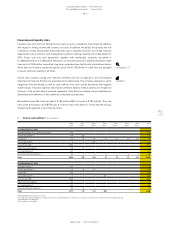
Financial Risks
Currency risks
Currency risks for the adidas Group are a direct result of multi-currency cash flows within the
Group. Furthermore, translation impacts from the conversion of non-euro-denominated results
into our Group’s functional currency, the euro, might lead to a material negative impact on
our Group’s financial performance. The biggest single driver behind this risk results from the
mismatch of the currencies required for sourcing our products versus the denominations of our
sales. The vast majority of our sourcing expenses are in US dollars, while sales are denominated
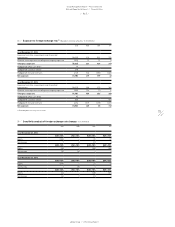
in other currencies to a large extent – most notably the euro. Our main exposures are presented
in the table. The exposure from firm commitments and forecasted transactions was calculated on
a one-year basis.
In line with IFRS 7 requirements, we have calculated the impact on net income and shareholders’
equity based on changes in our most important currency exchange rates. The calculated impacts
mainly result from changes in the fair value of our hedging instruments. The analysis does not
include effects that arise from the translation of our foreign entities’ financial statements into the
Group’s reporting currency, the euro. The sensitivity analysis is based on the net balance sheet
exposure, including intercompany balances from monetary assets and liabilities denominated
in foreign currencies. Moreover, all outstanding currency derivatives were re-evaluated using
hypothetical foreign exchange rates to determine the effects on net income and equity. The analysis
was performed on the same basis for both 2013 and 2014.
Based on this analysis, a 10% increase in the euro versus the US dollar at December 31, 2014
would have led to a € 7 million increase in net income. The more negative market values of the US
dollar hedges would have decreased shareholders’ equity by € 188 million. A 10% weaker euro at
December 31, 2014 would have led to a € 8 million decrease in net income. Shareholders’ equity
would have increased by € 233 million. The impacts of fluctuations of the US dollar against the
Russian rouble and of the euro against the British pound and the Japanese yen on net income and
shareholders’ equity are also included in accordance with IFRS requirements.
see Table 04
see Table 05