Reebok 2014 Annual Report Download - page 222
Download and view the complete annual report
Please find page 222 of the 2014 Reebok annual report below. You can navigate through the pages in the report by either clicking on the pages listed below, or by using the keyword search tool below to find specific information within the annual report.-
 1
1 -
2
-
3
-
4
-
5
-
6
-
7
-
8
-
9
-
10
-
11
-
12
-
13
-
14
-
15
-
16
-
17
-
18
-
19
-
20
-
21
-
22
-
23
-
24
-
25
-
26
-
27
-
28
-
29
-
30
-
31
-
32
-
33
-
34
-
35
-
36
-
37
-
38
-
39
-
40
-
41
-
42
-
43
-
44
-
45
-
46
-
47
-
48
-
49
-
50
-
51
-
52
-
53
-
54
-
55
-
56
-
57
-
58
-
59
-
60
-
61
-
62
-
63
-
64
-
65
-
66
-
67
-
68
-
69
-
70
-
71
-
72
-
73
-
74
-
75
-
76
-
77
-
78
-
79
-
80
-
81
-
82
-
83
-
84
-
85
-
86
-
87
-
88
-
89
-
90
-
91
-
92
-
93
-
94
-
95
-
96
-
97
-
98
-
99
-
100
-
101
-
102
-
103
-
104
-
105
-
106
-
107
-
108
-
109
-
110
-
111
-
112
-
113
-
114
-
115
-
116
-
117
-
118
-
119
-
120
-
121
-
122
-
123
-
124
-
125
-
126
-
127
-
128
-
129
-
130
-
131
-
132
-
133
-
134
-
135
-
136
-
137
-
138
-
139
-
140
-
141
-
142
-
143
-
144
-
145
-
146
-
147
-
148
-
149
-
150
-
151
-
152
-
153
-
154
-
155
-
156
-
157
-
158
-
159
-
160
-
161
-
162
-
163
-
164
-
165
-
166
-
167
-
168
-
169
-
170
-
171
-
172
-
173
-
174
-
175
-
176
-
177
-
178
-
179
-
180
-
181
-
182
-
183
-
184
-
185
-
186
-
187
-
188
-
189
-
190
-
191
-
192
-
193
-
194
-
195
-
196
-
197
-
198
-
199
-
200
-
201
-
202
-
203
-
204
-
205
-
206
-
207
-
208
-
209
-
210
-
211
-
 212
212 -
 213
213 -
 214
214 -
 215
215 -
 216
216 -
 217
217 -
 218
218 -
 219
219 -
 220
220 -
 221
221 -
 222
222 -
 223
223 -
 224
224 -
 225
225 -
 226
226 -
 227
227 -
 228
228 -
 229
229 -
 230
230 -
 231
231 -
 232
232 -
233
-
234
-
235
-
236
-
237
-
238
-
239
-
240
-
241
-
242
-
243
-
244
-
245
-
246
-
247
-
248
-
249
-
250
-
251
-
252
-
253
-
254
-
255
-
256
-
257
-
258
-
259
-
260
-
261
-
262
-
263
-
264
-
265
-
266
-
267
-
268
 |
 |

adidas Group
/
2014 Annual Report
Consolidated Financial Statements
218
2014
/
04.8
/
Notes
/
Notes to the Consolidated Statement of Financial Position
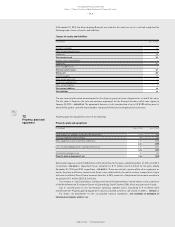
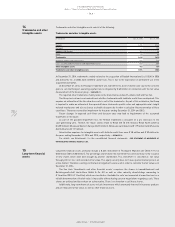
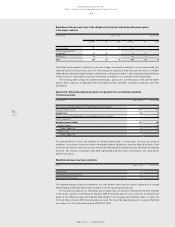
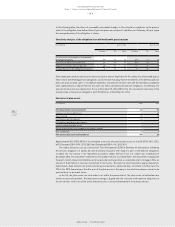
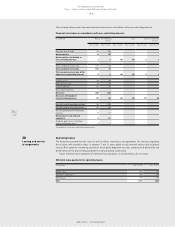
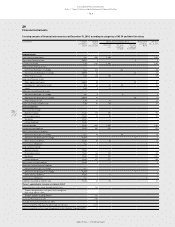
Breakdown of the present value of the obligation arising from defined benefit pension plans
in the major countries
(€ in millions) Dec. 31, 2014 Dec. 31, 2013
Germany UK Japan Germany UK Japan
Active members 178 – 15 123 – 14
Former employees with
vested rights 49 50 – 31 37 –
Pensioners 78 4 – 70 4 –
Total 305 54 15 224 41 14
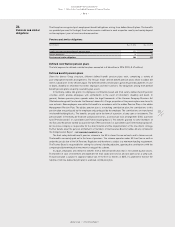
The Group’s pension plans are subject to risks from changes in actuarial assumptions, such as the discount rate,
salary and pension increase rates, and risks from changes in longevity. A lower discount rate results in a higher
defined benefit obligation and/or in higher contributions to the pension funds. Lower than expected performance
of the plan assets could lead to an increase in required contributions or to a decline of the funded status.
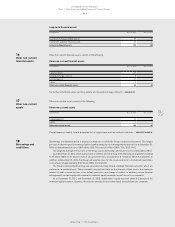
The following tables analyse the defined benefit plans, plan assets, present values of the defined benefit
pension plans, expenses recognised in the consolidated income statement, actuarial assumptions and other
information.
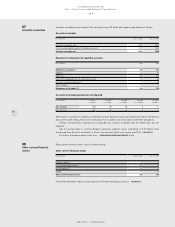
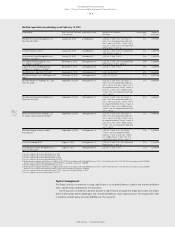
Amounts for defined benefit pension plans recognised in the consolidated statement
of financial position
(€ in millions) Dec. 31, 2014 Dec. 31, 2013
Present value of funded obligation from defined benefit pension plans 391 95
Fair value of plan assets (157) (83)
Funded status 234 12
Present value of unfunded obligation from defined benefit pension plans 37 230
Asset ceiling effect 0 1
Net defined benefit liability 271 243
Thereof: liability 271 243
Thereof: adidas AG 212 199
Thereof: asset (0) (0)
Thereof: adidas AG – –
The determination of assets and liabilities for defined benefit plans is based upon statistical and actuarial
valuations. In particular, the present value of the defined benefit obligation is driven by financial variables (such
as the discount rates or future increases in salaries) and demographic variables (such as mortality and employee
turnover). The actuarial assumptions may differ significantly from the actual circumstances and could lead to
different cash flows.
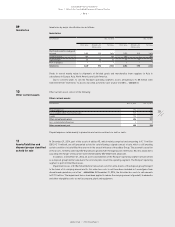
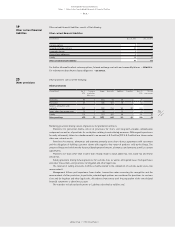
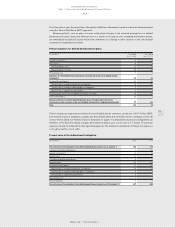
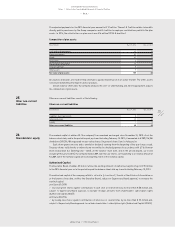
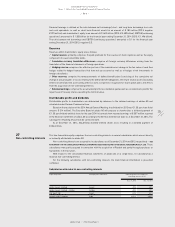
Weighted average actuarial assumptions
(in %) Dec. 31, 2014 Dec. 31, 2013
Discount rate 2.4 3.7
Expected rate of salary increases 3.2 3.2
Expected pension increases 1.7 2.2
The weighted average actuarial assumptions as at the balance sheet date are used to determine the defined
benefit liability at that date and the pension expense for the upcoming financial year.
The actuarial assumptions for withdrawal and mortality rates are based on statistical information available
in the various countries. In Germany, the Heubeck 2005 G mortality tables are used. In the UK, assumptions are
based on the S1NA base table with modified improvement of the life expectancy mortality tables. In Japan, the
‘21st Life Tables revised in 2010’ mortality tables are used. The rate of the expected pension increases in Germany
was reduced to 1.5% for the financial year 2014 (2013: 2.0%).