Reebok 2014 Annual Report Download - page 44
Download and view the complete annual report
Please find page 44 of the 2014 Reebok annual report below. You can navigate through the pages in the report by either clicking on the pages listed below, or by using the keyword search tool below to find specific information within the annual report.-
 1
1 -
2
-
3
-
4
-
5
-
6
-
7
-
8
-
9
-
10
-
11
-
12
-
13
-
14
-
15
-
16
-
17
-
18
-
19
-
20
-
21
-
22
-
23
-
24
-
25
-
26
-
27
-
28
-
29
-
30
-
31
-
32
-
33
-
 34
34 -
 35
35 -
 36
36 -
 37
37 -
 38
38 -
 39
39 -
 40
40 -
 41
41 -
 42
42 -
 43
43 -
 44
44 -
 45
45 -
 46
46 -
 47
47 -
 48
48 -
 49
49 -
 50
50 -
 51
51 -
 52
52 -
 53
53 -
 54
54 -
55
-
56
-
57
-
58
-
59
-
60
-
61
-
62
-
63
-
64
-
65
-
66
-
67
-
68
-
69
-
70
-
71
-
72
-
73
-
74
-
75
-
76
-
77
-
78
-
79
-
80
-
81
-
82
-
83
-
84
-
85
-
86
-
87
-
88
-
89
-
90
-
91
-
92
-
93
-
94
-
95
-
96
-
97
-
98
-
99
-
100
-
101
-
102
-
103
-
104
-
105
-
106
-
107
-
108
-
109
-
110
-
111
-
112
-
113
-
114
-
115
-
116
-
117
-
118
-
119
-
120
-
121
-
122
-
123
-
124
-
125
-
126
-
127
-
128
-
129
-
130
-
131
-
132
-
133
-
134
-
135
-
136
-
137
-
138
-
139
-
140
-
141
-
142
-
143
-
144
-
145
-
146
-
147
-
148
-
149
-
150
-
151
-
152
-
153
-
154
-
155
-
156
-
157
-
158
-
159
-
160
-
161
-
162
-
163
-
164
-
165
-
166
-
167
-
168
-
169
-
170
-
171
-
172
-
173
-
174
-
175
-
176
-
177
-
178
-
179
-
180
-
181
-
182
-
183
-
184
-
185
-
186
-
187
-
188
-
189
-
190
-
191
-
192
-
193
-
194
-
195
-
196
-
197
-
198
-
199
-
200
-
201
-
202
-
203
-
204
-
205
-
206
-
207
-
208
-
209
-
210
-
211
-
212
-
213
-
214
-
215
-
216
-
217
-
218
-
219
-
220
-
221
-
222
-
223
-
224
-
225
-
226
-
227
-
228
-
229
-
230
-
231
-
232
-
233
-
234
-
235
-
236
-
237
-
238
-
239
-
240
-
241
-
242
-
243
-
244
-
245
-
246
-
247
-
248
-
249
-
250
-
251
-
252
-
253
-
254
-
255
-
256
-
257
-
258
-
259
-
260
-
261
-
262
-
263
-
264
-
265
-
266
-
267
-
268
 |
 |
40
2014
/
01.7
/
Our Share
To Our Shareholders
adidas Group
/
2014 Annual Report
During the second quarter of 2014, the adidas AG share faced additional pressures, mainly as a
result of the overall equity market weakness. In particular, the continued depreciation of several
emerging market currencies versus the euro as well as geopolitical risk factors, such as the crisis
in Ukraine, negatively impacted the adidas AG share price development, given the adidas Group’s
high percentage of sales in emerging markets. In addition, negative newsflow with regard to the golf
market as well as unfavourable point-of-sale data in North America increased negative sentiment
towards the adidas AG share in June. On July 31, the adidas Group lowered its financial outlook for
2014 and postponed the delivery of its Route 2015 targets, mainly due to the continued weakness
in the golf market, negative developments in Russia/CIS as well as ongoing currency headwinds,
resulting in a significant share price decrease. Following the publication of the adidas Group’s
first half results on August 7, the adidas AG share suffered further losses, as market participants
remained concerned about the Group’s future top- and bottom-line development, waiting for
clear signals of better execution before turning more constructive on the adidas AG share again.
During the first half of the fourth quarter of 2014, the adidas AG share recovered and gained
steadily, supported by positive market feedback following the release of the nine months results
on November 7, with both top and bottom line exceeding market expectations. In particular, robust
sales momentum at both adidas and Reebok, ongoing strong performances in Western Europe
and emerging markets as well as Management’s confirmation of the full year 2014 guidance was
well received by market participants. However, towards the end of the year, the adidas AG share
again came under pressure, following several analyst reports indicating further margin pressure
in 2015, mainly due to the significant depreciation of the Russian rouble. As a result, the adidas AG
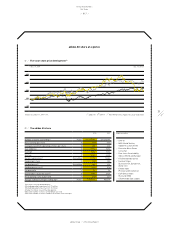
share closed 2014 at € 57.62, representing a 38% decrease over the year. This implies a market
capitalisation of € 11.8 billion at the end of 2014 versus € 19.4 billion at the end of 2013.
see Diagram 02
see Diagram 03
04
/
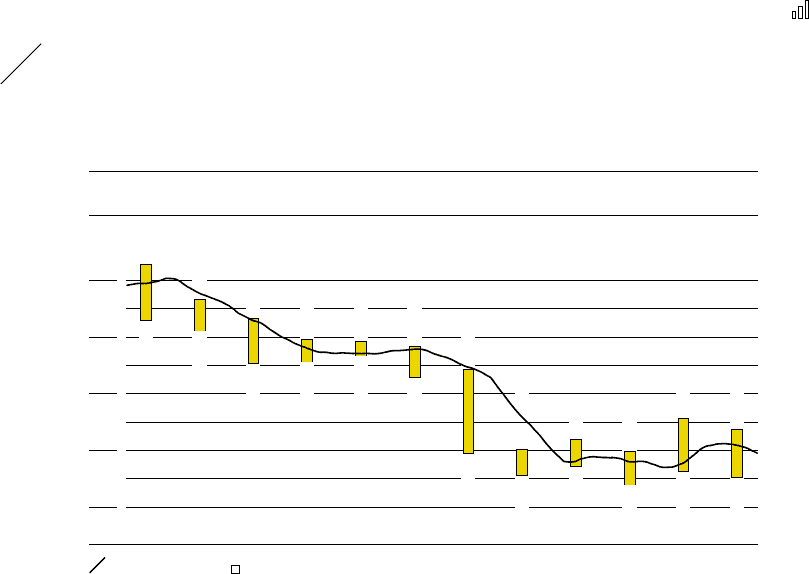
2014 adidas AG high and low share prices per month 1) (in €)
| Jan Feb Mar Apr May Jun Jul Aug Sep Oct Nov Dec |
90
80
70
60
50
30-day moving average ■ High and low share prices Source: Bloomberg.
1) Based on daily Xetra closing prices.
92.9282.89
86.7381.02
83.4075.34
79.6075.57
79.3076.64
78.5072.86
74.3759.41
60.3055.50
62.0357.09
59.8653.89
65.7256.27
63.7455.14