Reebok 2014 Annual Report Download - page 186
Download and view the complete annual report
Please find page 186 of the 2014 Reebok annual report below. You can navigate through the pages in the report by either clicking on the pages listed below, or by using the keyword search tool below to find specific information within the annual report.-
 1
1 -
2
-
3
-
4
-
5
-
6
-
7
-
8
-
9
-
10
-
11
-
12
-
13
-
14
-
15
-
16
-
17
-
18
-
19
-
20
-
21
-
22
-
23
-
24
-
25
-
26
-
27
-
28
-
29
-
30
-
31
-
32
-
33
-
34
-
35
-
36
-
37
-
38
-
39
-
40
-
41
-
42
-
43
-
44
-
45
-
46
-
47
-
48
-
49
-
50
-
51
-
52
-
53
-
54
-
55
-
56
-
57
-
58
-
59
-
60
-
61
-
62
-
63
-
64
-
65
-
66
-
67
-
68
-
69
-
70
-
71
-
72
-
73
-
74
-
75
-
76
-
77
-
78
-
79
-
80
-
81
-
82
-
83
-
84
-
85
-
86
-
87
-
88
-
89
-
90
-
91
-
92
-
93
-
94
-
95
-
96
-
97
-
98
-
99
-
100
-
101
-
102
-
103
-
104
-
105
-
106
-
107
-
108
-
109
-
110
-
111
-
112
-
113
-
114
-
115
-
116
-
117
-
118
-
119
-
120
-
121
-
122
-
123
-
124
-
125
-
126
-
127
-
128
-
129
-
130
-
131
-
132
-
133
-
134
-
135
-
136
-
137
-
138
-
139
-
140
-
141
-
142
-
143
-
144
-
145
-
146
-
147
-
148
-
149
-
150
-
151
-
152
-
153
-
154
-
155
-
156
-
157
-
158
-
159
-
160
-
161
-
162
-
163
-
164
-
165
-
166
-
167
-
168
-
169
-
170
-
171
-
172
-
173
-
174
-
175
-
 176
176 -
 177
177 -
 178
178 -
 179
179 -
 180
180 -
 181
181 -
 182
182 -
 183
183 -
 184
184 -
 185
185 -
 186
186 -
 187
187 -
 188
188 -
 189
189 -
 190
190 -
 191
191 -
 192
192 -
 193
193 -
 194
194 -
 195
195 -
 196
196 -
197
-
198
-
199
-
200
-
201
-
202
-
203
-
204
-
205
-
206
-
207
-
208
-
209
-
210
-
211
-
212
-
213
-
214
-
215
-
216
-
217
-
218
-
219
-
220
-
221
-
222
-
223
-
224
-
225
-
226
-
227
-
228
-
229
-
230
-
231
-
232
-
233
-
234
-
235
-
236
-
237
-
238
-
239
-
240
-
241
-
242
-
243
-
244
-
245
-
246
-
247
-
248
-
249
-
250
-
251
-
252
-
253
-
254
-
255
-
256
-
257
-
258
-
259
-
260
-
261
-
262
-
263
-
264
-
265
-
266
-
267
-
268
 |
 |
182
2014
Management Assessment of Performance, Risks and Opportunities, and Outlook
/
03.6
/
adidas Group
/
2014 Annual Report
Group Management Report – Financial Review
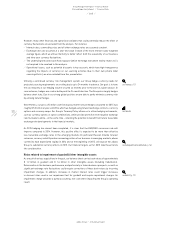
Beyond our financial performance, we also actively monitor the Group’s key non-financial KPIs on a
regular basis, as available. From a market share perspective, we continue to be very encouraged by
our strong performance compared to our major competitors in key emerging markets. In particular,
Greater China, Latin America and South Korea were notable standouts, as we further improved our
market share in these markets in 2014. In Western Europe, we saw momentum accelerate in 2014,
supported by the positive effects from the 2014 FIFA World Cup. Less pleasing, however, was our
underperformance in North America, which continued in 2014. As a result, we have made several
changes to our organisational set-up in the market and also announced that we will step up brand
investments to engage more closely with the US consumer. In the golf market, despite a challenging
year for TaylorMade-adidas Golf, we continue to enjoy healthy market share positions. We remain
market leader in key categories such as metalwoods and irons, with market shares above 30%
and 20%, respectively. A key focus for TaylorMade-adidas Golf in 2014 was the clean-up of retail
inventories, especially in the USA. In light of this, TaylorMade-adidas Golf made the strategic
decision to reduce the number of new product introductions compared to previous years.
We continued to maintain a very strong level of on-time in-full (OTIF) deliveries to our customers and
own-retail stores in 2014. As in prior years, the majority of our sales in 2014 were again generated
from products launched in the past 12 to 18 months. In addition, we received several awards and
industry recognitions for our new product innovations. Finally, our diligence and discipline in
sustainability matters continues to yield strong recognition for our Group. In 2014, for the 15th
consecutive time, we were selected to join the Dow Jones Sustainability Indexes (DJSI) and scored
industry-best ratings in the categories ‘Supply Chain Management’, ‘Product Stewardship’ and
‘Stakeholder Engagement’ in the sector ‘Textiles, Apparel & Luxury Goods’.
Assessment of overall risks and opportunities
The Group’s Risk Management team aggregates all risks and opportunities reported by different
business units and functions through the quarterly risk and opportunity assessment process. In
addition, the Group’s Executive Board discusses and assesses Group risks and opportunities on
a regular basis. Taking into account the potential financial impact as well as the likelihood of
materialising of the risks explained within this report, and considering the strong balance sheet
as well as the current business outlook, we do not foresee any material jeopardy to the viability of
see Internal Group Management System, p. 98
see Global Operations, p. 66
see Research and Development, p. 73
see Sustainability, p. 89
01
/
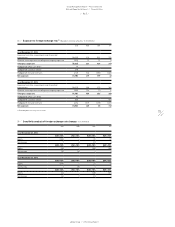
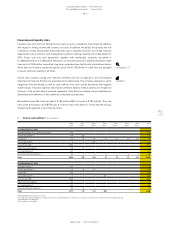
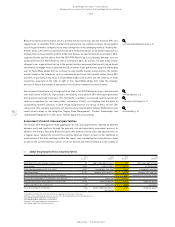
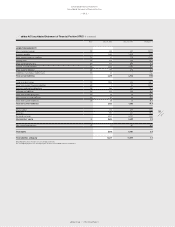
adidas Group targets versus actual key metrics
2013
Results 1)
2014
Targets 1)
2014
Results 2)
2015
Outlook 2)
Sales (year-over-year change, currency-neutral) 3% high-single-digit increase 6% mid-single-digit increase
Gross margin 49.3% 49.5% to 49.8% 47.6% 47.5% to 48.5%
Other operating expenses (in % of sales) 42.3% around prior year level 42.7% around prior year level
Operating margin 8.7% 3) between 8.5% and 9.0% 6.6% 4) between 6.5% and 7.0%
Net income from continuing operations (€ in million) – – 642 4) increase at a rate of 7% to 10%
Net income attributable to shareholders (€ in million) 839 3) 830 to 930 568 4) 5) –
Average operating working capital (in % of net sales) 20.9% moderate decline 22.4% moderate decline
Capital expenditure (€ in millions) 6) 479 500 to 550 554 5) around 600
Gross borrowings (€ in millions) 1,334 further reduction of gross
borrowings
1,873 5) moderate decline
1) As published on March 5, 2014. The outlook was updated over the course of the year.
2) Figures reflect continuing operations as a result of the planned divestiture of the Rockport business.
3) Excluding goodwill impairment of € 52 million.
4) Excluding goodwill impairment of € 78 million.
5) Includes continuing and discontinued operations.
6) Excluding acquisitions and finance leases.