Reebok 2014 Annual Report Download - page 124
Download and view the complete annual report
Please find page 124 of the 2014 Reebok annual report below. You can navigate through the pages in the report by either clicking on the pages listed below, or by using the keyword search tool below to find specific information within the annual report.-
 1
1 -
2
-
3
-
4
-
5
-
6
-
7
-
8
-
9
-
10
-
11
-
12
-
13
-
14
-
15
-
16
-
17
-
18
-
19
-
20
-
21
-
22
-
23
-
24
-
25
-
26
-
27
-
28
-
29
-
30
-
31
-
32
-
33
-
34
-
35
-
36
-
37
-
38
-
39
-
40
-
41
-
42
-
43
-
44
-
45
-
46
-
47
-
48
-
49
-
50
-
51
-
52
-
53
-
54
-
55
-
56
-
57
-
58
-
59
-
60
-
61
-
62
-
63
-
64
-
65
-
66
-
67
-
68
-
69
-
70
-
71
-
72
-
73
-
74
-
75
-
76
-
77
-
78
-
79
-
80
-
81
-
82
-
83
-
84
-
85
-
86
-
87
-
88
-
89
-
90
-
91
-
92
-
93
-
94
-
95
-
96
-
97
-
98
-
99
-
100
-
101
-
102
-
103
-
104
-
105
-
106
-
107
-
108
-
109
-
110
-
111
-
112
-
113
-
 114
114 -
 115
115 -
 116
116 -
 117
117 -
 118
118 -
 119
119 -
 120
120 -
 121
121 -
 122
122 -
 123
123 -
 124
124 -
 125
125 -
 126
126 -
 127
127 -
 128
128 -
 129
129 -
 130
130 -
 131
131 -
 132
132 -
 133
133 -
 134
134 -
135
-
136
-
137
-
138
-
139
-
140
-
141
-
142
-
143
-
144
-
145
-
146
-
147
-
148
-
149
-
150
-
151
-
152
-
153
-
154
-
155
-
156
-
157
-
158
-
159
-
160
-
161
-
162
-
163
-
164
-
165
-
166
-
167
-
168
-
169
-
170
-
171
-
172
-
173
-
174
-
175
-
176
-
177
-
178
-
179
-
180
-
181
-
182
-
183
-
184
-
185
-
186
-
187
-
188
-
189
-
190
-
191
-
192
-
193
-
194
-
195
-
196
-
197
-
198
-
199
-
200
-
201
-
202
-
203
-
204
-
205
-
206
-
207
-
208
-
209
-
210
-
211
-
212
-
213
-
214
-
215
-
216
-
217
-
218
-
219
-
220
-
221
-
222
-
223
-
224
-
225
-
226
-
227
-
228
-
229
-
230
-
231
-
232
-
233
-
234
-
235
-
236
-
237
-
238
-
239
-
240
-
241
-
242
-
243
-
244
-
245
-
246
-
247
-
248
-
249
-
250
-
251
-
252
-
253
-
254
-
255
-
256
-
257
-
258
-
259
-
260
-
261
-
262
-
263
-
264
-
265
-
266
-
267
-
268
 |
 |
120
2014
/
03.2
/
adidas Group
/
2014 Annual Report
Group Management Report – Financial Review
Group Business Performance
/
Statement of Financial Position and Statement of Cash Flows
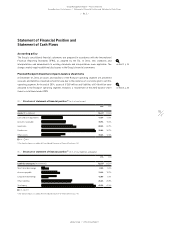
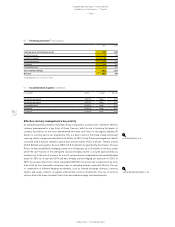
Liquidity analysis
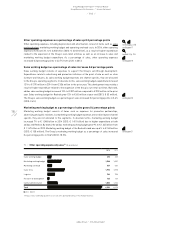
In 2014, net cash generated from operating activities increased to € 701 million (2013:
€ 634 million). Net cash generated from continuing operating activities increased to € 694 million
(2013: € 608 million), primarily as a result of lower operating working capital requirements as
well as lower income taxes paid, partly offset by a decline in income before taxes. Net cash used
in investing activities more than doubled to € 537 million (2013: € 243 million). Net cash used in
continuing investing activities also more than doubled to € 531 million (2013: € 237 million), mainly
as a result of lower proceeds from the sale of short–term financial assets. The majority of investing
activities in 2014 related to spending for property, plant and equipment, such as investments in the
furnishing and fitting of stores in our Retail segment as well as investments in the Group’s logistics
infrastructure and IT systems. Net cash used in financing activities totalled € 118 million (2013:
€ 439 million). The repayment of the Group’s Eurobond of € 500 million, the dividend of € 314 million
paid to shareholders as well as the repurchase of treasury shares in the amount of € 300 million
were partly offset by proceeds from the issuance of two Eurobonds in an amount of € 990 million.
Exchange rate effects positively impacted the Group’s cash position by € 50 million in 2014 (2013:
negative impact of € 35 million). As a result of all these developments, cash and cash equivalents
increased € 96 million to € 1.683 billion at the end of December 2014 compared to € 1.587 billion
at the end of December 2013. Net borrowings at December 31, 2014 amounted to € 185 million,
compared to net cash of € 295 million in 2013, representing a decrease of € 479 million. This
development is mainly a result of higher capital expenditure during 2014 as well as the utilisation
of cash for the first tranche of our share buyback programme in an amount of € 300 million.
Currency translation had a positive effect of € 36 million on net borrowings. The Group’s ratio of net
borrowings over EBITDA amounted to 0.1 at the end of December 2014 (2013: –0.2).
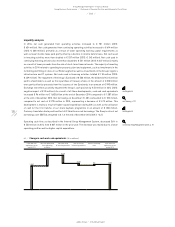
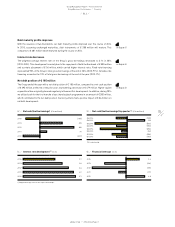
Operating cash flow, as described in the Internal Group Management System, decreased 36% to
€ 530 million in 2014 from € 827 million in the prior year. The decrease was mainly due to a lower
operating profit as well as higher capital expenditure.
see Diagram 46
see Treasury, p. 121
see Diagram 45
see Internal Group Management System, p. 98
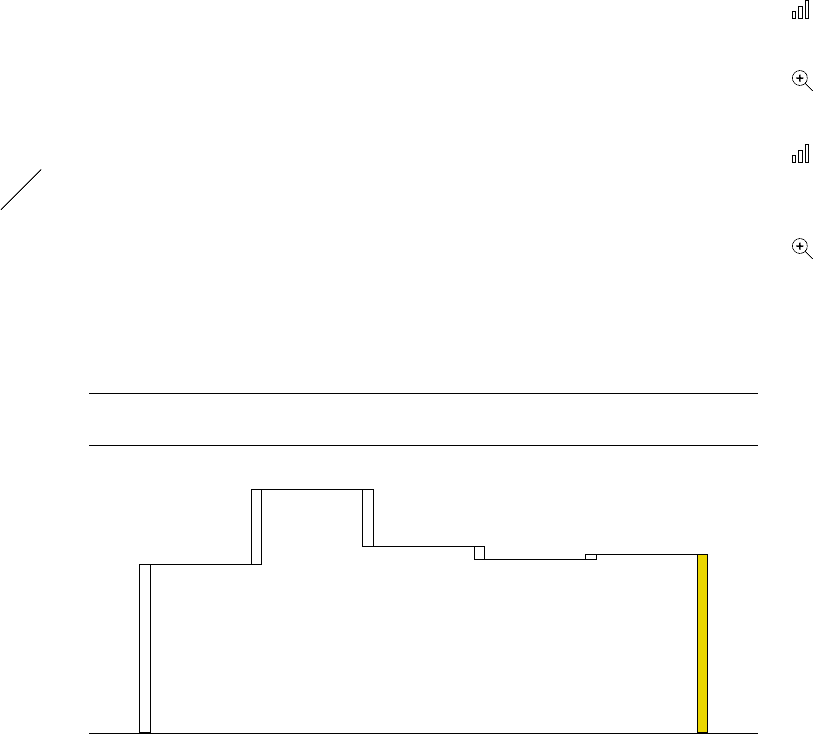
46
/
Change in cash and cash equivalents (€ in millions)
Cash and cash
equivalents at the
end of 2013
Net cash generated
from operating
activities
Net cash used
in investing activities
Net cash used
in financing activities
Effect of exchange
rates
Cash and cash
equivalents at the
end of 2014
1,587
701 (537)
50
(118) 1,683