Reebok 2014 Annual Report Download - page 246
Download and view the complete annual report
Please find page 246 of the 2014 Reebok annual report below. You can navigate through the pages in the report by either clicking on the pages listed below, or by using the keyword search tool below to find specific information within the annual report.-
 1
1 -
2
-
3
-
4
-
5
-
6
-
7
-
8
-
9
-
10
-
11
-
12
-
13
-
14
-
15
-
16
-
17
-
18
-
19
-
20
-
21
-
22
-
23
-
24
-
25
-
26
-
27
-
28
-
29
-
30
-
31
-
32
-
33
-
34
-
35
-
36
-
37
-
38
-
39
-
40
-
41
-
42
-
43
-
44
-
45
-
46
-
47
-
48
-
49
-
50
-
51
-
52
-
53
-
54
-
55
-
56
-
57
-
58
-
59
-
60
-
61
-
62
-
63
-
64
-
65
-
66
-
67
-
68
-
69
-
70
-
71
-
72
-
73
-
74
-
75
-
76
-
77
-
78
-
79
-
80
-
81
-
82
-
83
-
84
-
85
-
86
-
87
-
88
-
89
-
90
-
91
-
92
-
93
-
94
-
95
-
96
-
97
-
98
-
99
-
100
-
101
-
102
-
103
-
104
-
105
-
106
-
107
-
108
-
109
-
110
-
111
-
112
-
113
-
114
-
115
-
116
-
117
-
118
-
119
-
120
-
121
-
122
-
123
-
124
-
125
-
126
-
127
-
128
-
129
-
130
-
131
-
132
-
133
-
134
-
135
-
136
-
137
-
138
-
139
-
140
-
141
-
142
-
143
-
144
-
145
-
146
-
147
-
148
-
149
-
150
-
151
-
152
-
153
-
154
-
155
-
156
-
157
-
158
-
159
-
160
-
161
-
162
-
163
-
164
-
165
-
166
-
167
-
168
-
169
-
170
-
171
-
172
-
173
-
174
-
175
-
176
-
177
-
178
-
179
-
180
-
181
-
182
-
183
-
184
-
185
-
186
-
187
-
188
-
189
-
190
-
191
-
192
-
193
-
194
-
195
-
196
-
197
-
198
-
199
-
200
-
201
-
202
-
203
-
204
-
205
-
206
-
207
-
208
-
209
-
210
-
211
-
212
-
213
-
214
-
215
-
216
-
217
-
218
-
219
-
220
-
221
-
222
-
223
-
224
-
225
-
226
-
227
-
228
-
229
-
230
-
231
-
232
-
233
-
234
-
235
-
 236
236 -
 237
237 -
 238
238 -
 239
239 -
 240
240 -
 241
241 -
 242
242 -
 243
243 -
 244
244 -
 245
245 -
 246
246 -
 247
247 -
 248
248 -
 249
249 -
 250
250 -
 251
251 -
 252
252 -
 253
253 -
 254
254 -
 255
255 -
 256
256 -
257
-
258
-
259
-
260
-
261
-
262
-
263
-
264
-
265
-
266
-
267
-
268
 |
 |
adidas Group
/
2014 Annual Report
Consolidated Financial Statements
242
2014
/
04.8
/
Notes
/
Notes – Additional Information
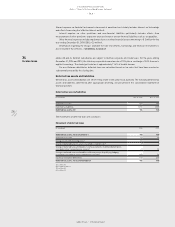
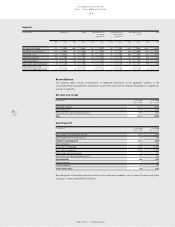
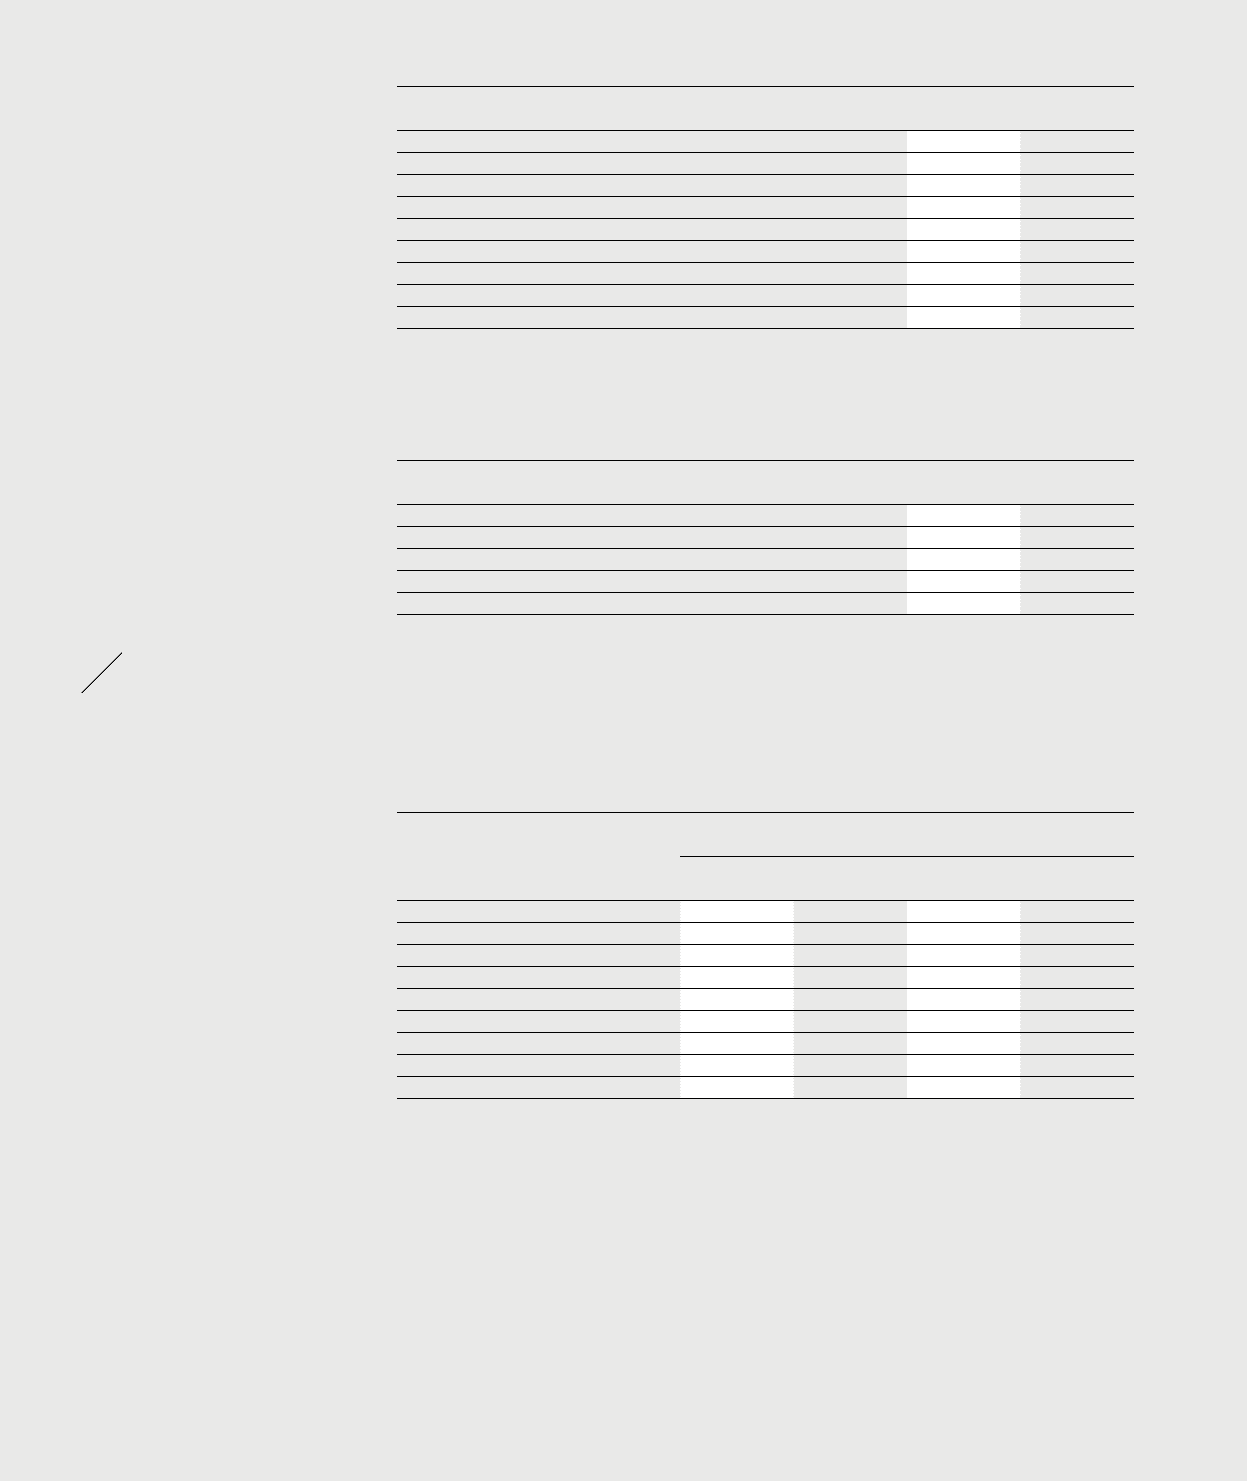
Liabilities
(€ in millions) Dec. 31, 2014 Dec. 31, 2013
Accounts payable of reportable segments 483 459
Accounts payable of Other Businesses 171 176
Segmental liabilities 654 635
Non-segmental accounts payable 1,035 1,190
Current financial liabilities 379 794
Other current liabilities 2,346 2,113
Non-current liabilities 2,422 1,386
Reclassification to liabilities classified as held for sale (37) –
Total 6,799 6,118
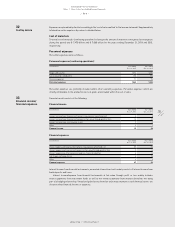
Product information
Net sales (non-Group)
(€ in millions) Year ending
Dec. 31, 2014
Year ending
Dec. 31, 2013
Footwear 6,939 6,873
Apparel 6,281 5,813
Hardware 1,597 1,806
Reclassification to discontinued operations (283) (289)
Total 14,534 14,203
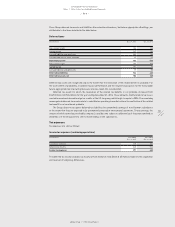
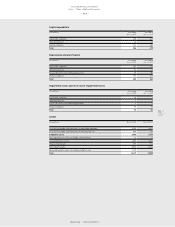
Geographical information
Net sales (non-Group) are shown in the geographic market in which the net sales are realised. Non-current
assets are allocated to the geographic market based on the domicile of the respective subsidiary independent of
the segmental structure and consist of tangible assets, goodwill, trademarks, other intangible assets and other
non-current assets.
Geographical information
(€ in millions) Net sales (non-Group) Non-current assets
Year ending
Dec. 31, 2014
Year ending
Dec. 31, 2013
Dec. 31, 2014 Dec. 31, 2013
Western Europe 4,138 3,800 1,619 1,488
European Emerging Markets 1,959 1,894 563 608
North America 3,124 3,362 1,107 1,023
Greater China 1,811 1,655 359 296
Other Asian Markets 2,157 2,206 438 483
Latin America 1,627 1,575 236 208
HQ/Consolidation 0 0 0 0
Reclassification to discontinued operations (283) (289) – –
Total 14,534 14,203 4,322 4,106
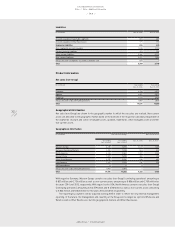
With regard to Germany, Western Europe contains net sales (non-Group) (continuing operations) amounting to
€ 827 million and € 724 million as well as non-current assets amounting to € 806 million and € 739 million for
the years 2014 and 2013, respectively. With regard to the USA, North America contains net sales (non-Group)
(continuing operations) amounting to € 2.579 billion and € 2.782 billion as well as non-current assets amounting
to € 833 million and € 862 million for the years 2014 and 2013, respectively.
The reporting by segments will be adjusted starting 2015 in order to reflect the new internal management
reporting. In the future, the management and reporting of the Group will no longer be split into Wholesale and
Retail as well as Other Businesses, but into geographical markets and Other Businesses.