Duke Energy 2011 Annual Report Download - page 92
Download and view the complete annual report
Please find page 92 of the 2011 Duke Energy annual report below. You can navigate through the pages in the report by either clicking on the pages listed below, or by using the keyword search tool below to find specific information within the annual report.-
 1
1 -
2
-
3
-
4
-
5
-
6
-
7
-
8
-
9
-
10
-
11
-
12
-
13
-
14
-
15
-
16
-
17
-
18
-
19
-
20
-
21
-
22
-
23
-
24
-
25
-
26
-
27
-
28
-
29
-
30
-
31
-
32
-
33
-
34
-
35
-
36
-
37
-
38
-
39
-
40
-
41
-
42
-
43
-
44
-
45
-
46
-
47
-
48
-
49
-
50
-
51
-
52
-
53
-
54
-
55
-
56
-
57
-
58
-
59
-
60
-
61
-
62
-
63
-
64
-
65
-
66
-
67
-
68
-
69
-
70
-
71
-
72
-
73
-
74
-
75
-
76
-
77
-
78
-
79
-
80
-
81
-
 82
82 -
 83
83 -
 84
84 -
 85
85 -
 86
86 -
 87
87 -
 88
88 -
 89
89 -
 90
90 -
 91
91 -
 92
92 -
 93
93 -
 94
94 -
 95
95 -
 96
96 -
 97
97 -
 98
98 -
 99
99 -
 100
100 -
 101
101 -
 102
102 -
103
-
104
-
105
-
106
-
107
-
108
-
109
-
110
-
111
-
112
-
113
-
114
-
115
-
116
-
117
-
118
-
119
-
120
-
121
-
122
-
123
-
124
-
125
-
126
-
127
-
128
-
129
-
130
-
131
-
132
-
133
-
134
-
135
-
136
-
137
-
138
-
139
-
140
-
141
-
142
-
143
-
144
-
145
-
146
-
147
-
148
-
149
-
150
-
151
-
152
-
153
-
154
-
155
-
156
-
157
-
158
-
159
-
160
-
161
-
162
-
163
-
164
-
165
-
166
-
167
-
168
-
169
-
170
-
171
-
172
-
173
-
174
-
175
-
176
-
177
-
178
-
179
-
180
-
181
-
182
-
183
-
184
-
185
-
186
-
187
-
188
-
189
-
190
-
191
-
192
-
193
-
194
-
195
-
196
-
197
-
198
-
199
-
200
-
201
-
202
-
203
-
204
-
205
-
206
-
207
-
208
-
209
-
210
-
211
-
212
-
213
-
214
-
215
-
216
-
217
-
218
-
219
-
220
-
221
-
222
-
223
-
224
-
225
-
226
-
227
-
228
-
229
-
230
-
231
-
232
-
233
-
234
-
235
-
236
-
237
-
238
-
239
-
240
-
241
-
242
-
243
-
244
-
245
-
246
-
247
-
248
-
249
-
250
-
251
-
252
-
253
-
254
-
255
-
256
-
257
-
258
-
259
-
260
-
261
-
262
-
263
-
264
-
265
-
266
-
267
-
268
-
269
-
270
-
271
-
272
-
273
-
274
-
275
 |
 |

PART II
Pension Plan Assets.
Duke Energy maintains investments to help fund the costs of
providing non-contributory defined benefit retirement and other post-
retirement benefit plans. These investments are exposed to price
fluctuations in equity markets and changes in interest rates. The
equity securities held in Duke Energy’s pension plans are diversified
to achieve broad market participation and reduce the impact of any
single investment, sector or geographic region. Duke Energy has
established asset allocation targets for its pension plan holdings,
which take into consideration the investment objectives and the risk
profile with respect to the trust in which the assets are held. These
target allocations are presented in the table below.
Target Asset allocation for Pension Plan Assets
Asset Target Allocation %
Equity Securities 56%
Debt Securities 32%
Other 12%
A significant decline in the value of plan asset holdings could
require Duke Energy to increase its funding of the pension plan in
future periods, which could adversely affect cash flows in those periods.
Additionally, a decline in the fair value of plan assets, absent additional
cash contributions to the plan, could increase the amount of pension
cost required to be recorded in future periods, which could adversely
affect Duke Energy’s results of operations in those periods. The
Subsidiary Registrants’ proportionate share of Duke Energy’s costs of
providing non-contributory defined benefit retirement and other post-
retirement benefit plans are dependent upon a number of factors, such
as the rates of return on plan assets, discount rate, the rate of increase
in health care costs and contributions made to the plans. During 2011,
Duke Energy contributed $200 million to its qualified pension plan of
which $33 million was funded by Duke Energy Carolinas, $48 million
was funded by Duke Energy Ohio and $52 million was funded by
Duke Energy Indiana. Duke Energy intends to contribute $200 million
to its qualified pension plan in 2012. See Note 21 to the Consolidated
Financial Statements, “Employee Benefit Plans,” for additional
information on pension plan assets.
NDTF.
As required by the NRC and the NCUC, Duke Energy Carolinas
maintains trust funds to fund the costs of nuclear decommissioning
(see Note 9 to the Consolidated Financial Statements, “Asset
Retirement Obligations”). As of December 31, 2011, these funds
were invested primarily in domestic and international equity
securities, debt securities, fixed-income securities, cash and cash
equivalents and short-term investments. Per the NRC and the NCUC
requirements, these funds may be used only for activities related to
nuclear decommissioning. The investments in equity securities are
exposed to price fluctuations in equity markets. Accounting for
nuclear decommissioning recognizes that costs are recovered through
Duke Energy Carolinas’ rates; therefore, fluctuations in equity prices
do not affect Duke Energy Carolinas’ Consolidated Statements of
Operations as changes in the fair value of these investments are
deferred as regulatory assets or regulatory liabilities pursuant to an
Order by the NCUC. Earnings or losses of the fund will ultimately
impact the amount of costs recovered through Duke Energy Carolinas’
rates. See Note 9 to the Consolidated Financial Statements, “Asset
Retirement Obligations” for additional information regarding nuclear
decommissioning costs. See Note 16 to the Consolidated Financial
Statements, “Investments in Debt and Equity Securities” for additional
information regarding NTDF assets.
Foreign Currency Risk
Duke Energy is exposed to foreign currency risk from
investments in international affiliate businesses owned and operated
in foreign countries and from certain commodity-related transactions
within domestic operations that are denominated in foreign
currencies. To mitigate risks associated with foreign currency
fluctuations, contracts may be denominated in or indexed to the
U.S. Dollar/inflation rates and/or local inflation rates, or investments
may be naturally hedged through debt denominated or issued in the
foreign currency. Duke Energy may also use foreign currency
derivatives, where possible, to manage its risk related to foreign
currency fluctuations. To monitor its currency exchange rate risks,
Duke Energy uses sensitivity analysis, which measures the impact of
devaluation of the foreign currencies to which it has exposure.
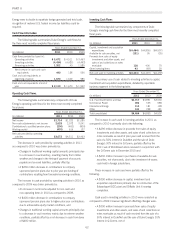
In 2011, Duke Energy’s primary foreign currency rate exposure
was to the Brazilian Real. The table below summarizes the potential
effect of foreign currency devaluations on Duke Energy’s Consolidated
Statement of Operations and Consolidated Balance Sheets, based on
a sensitivity analysis performed as of December 31, 2011 and
December 31, 2010.
Summary of Sensitivity Analysis for Foreign Currency Risks
($ in millions)
Assuming 10% devaluation in the currency
exchange rates in all exposure currencies
As of December 31,
2011
As of December 31,
2010
Income Statement Impact(a) $ (20) $ (20)
Balance Sheet Impact(b) $(160) $(180)
(a) Amounts represent the potential annual net pre-tax loss on the translation of local
currency earnings to the Consolidated Statement of Operations in 2012 and 2011,
respectively.
(b) Amounts represent the potential impact to the currency translation through the
cumulative translation adjustment in Accumulated Other Comprehensive Income
(AOCI) on the Consolidated Balance Sheets.
Other Issues
General.
The Duke Energy Registrants’ fixed charges coverage ratios, as
calculated using SEC guidelines, are included in the table below.
Years Ended December 31,
2011 2010 2009
Duke Energy 3.2 3.0 3.0
Duke Energy Carolinas 3.7 3.6 3.5
Duke Energy Ohio 3.4 (a) (a)
Duke Energy Indiana 2.2 3.6 2.9
(a) Duke Energy Ohio’s earnings were insufficient to cover fixed charges by $317 million
in 2010 and $244 million in 2009 due primarily to non-cash goodwill and other asset
impairment charges of $677 million in 2010 and $727 million in 2009, respectively.
72