Duke Energy 2011 Annual Report Download - page 182
Download and view the complete annual report
Please find page 182 of the 2011 Duke Energy annual report below. You can navigate through the pages in the report by either clicking on the pages listed below, or by using the keyword search tool below to find specific information within the annual report.-
 1
1 -
2
-
3
-
4
-
5
-
6
-
7
-
8
-
9
-
10
-
11
-
12
-
13
-
14
-
15
-
16
-
17
-
18
-
19
-
20
-
21
-
22
-
23
-
24
-
25
-
26
-
27
-
28
-
29
-
30
-
31
-
32
-
33
-
34
-
35
-
36
-
37
-
38
-
39
-
40
-
41
-
42
-
43
-
44
-
45
-
46
-
47
-
48
-
49
-
50
-
51
-
52
-
53
-
54
-
55
-
56
-
57
-
58
-
59
-
60
-
61
-
62
-
63
-
64
-
65
-
66
-
67
-
68
-
69
-
70
-
71
-
72
-
73
-
74
-
75
-
76
-
77
-
78
-
79
-
80
-
81
-
82
-
83
-
84
-
85
-
86
-
87
-
88
-
89
-
90
-
91
-
92
-
93
-
94
-
95
-
96
-
97
-
98
-
99
-
100
-
101
-
102
-
103
-
104
-
105
-
106
-
107
-
108
-
109
-
110
-
111
-
112
-
113
-
114
-
115
-
116
-
117
-
118
-
119
-
120
-
121
-
122
-
123
-
124
-
125
-
126
-
127
-
128
-
129
-
130
-
131
-
132
-
133
-
134
-
135
-
136
-
137
-
138
-
139
-
140
-
141
-
142
-
143
-
144
-
145
-
146
-
147
-
148
-
149
-
150
-
151
-
152
-
153
-
154
-
155
-
156
-
157
-
158
-
159
-
160
-
161
-
162
-
163
-
164
-
165
-
166
-
167
-
168
-
169
-
170
-
171
-
 172
172 -
 173
173 -
 174
174 -
 175
175 -
 176
176 -
 177
177 -
 178
178 -
 179
179 -
 180
180 -
 181
181 -
 182
182 -
 183
183 -
 184
184 -
 185
185 -
 186
186 -
 187
187 -
 188
188 -
 189
189 -
 190
190 -
 191
191 -
 192
192 -
193
-
194
-
195
-
196
-
197
-
198
-
199
-
200
-
201
-
202
-
203
-
204
-
205
-
206
-
207
-
208
-
209
-
210
-
211
-
212
-
213
-
214
-
215
-
216
-
217
-
218
-
219
-
220
-
221
-
222
-
223
-
224
-
225
-
226
-
227
-
228
-
229
-
230
-
231
-
232
-
233
-
234
-
235
-
236
-
237
-
238
-
239
-
240
-
241
-
242
-
243
-
244
-
245
-
246
-
247
-
248
-
249
-
250
-
251
-
252
-
253
-
254
-
255
-
256
-
257
-
258
-
259
-
260
-
261
-
262
-
263
-
264
-
265
-
266
-
267
-
268
-
269
-
270
-
271
-
272
-
273
-
274
-
275
 |
 |

PART II
DUKE ENERGY CORPORATION •DUKE ENERGY CAROLINAS, LLC •DUKE ENERGY OHIO, INC. •DUKE ENERGY INDIANA, INC.
Combined Notes to Consolidated Financial Statements – (Continued)
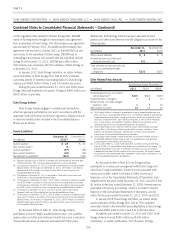
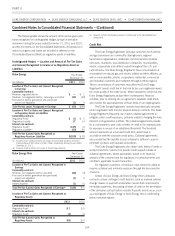
below. For additional information on notional dollar amounts of debt
subject to derivative contracts accounted for at fair value, see “Interest
Rate Risk” section above.
Underlying Notional Amounts for Derivative Instruments
Accounted for At Fair Value
Duke Energy
December 31,
2011
December 31,
2010
Electricity-energy (Gigawatt-hours) 14,118 8,200
Electricity-capacity (Gigawatt-months) —58
Emission allowances: SO2(thousands
of tons) —8
Emission allowances: NOX(thousands
of tons) 9—
Natural gas (millions of decatherms) 40 37
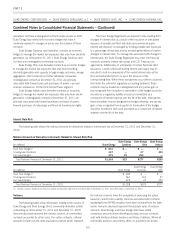
Duke Energy Ohio
December 31,
2011
December 31,
2010
Electricity-energy (Gigawatt-hours)(a) 14,655 13,183
Electricity-capacity (Gigawatt-months) —60
Emission allowances: NOX(thousands
of tons) 9—
Natural gas (millions of decatherms) 2—
(a) Amounts include intercompany positions that eliminate at the consolidated Duke
Energy level.
Thefollowingtableshowsfairvalueamountsofderivative
contracts as of December 31, 2011 and 2010, and the line item(s)
in the Consolidated Balance Sheets in which such amounts are
included. The fair values of derivative contracts are presented on a
gross basis, even when the derivative instruments are subject to
master netting arrangements where Duke Energy nets the fair value of
derivative contracts subject to master netting arrangements with the
same counterparty on the Consolidated Balance Sheets. Cash
collateral payables and receivables associated with the derivative
contracts have not been netted against the fair value amounts.
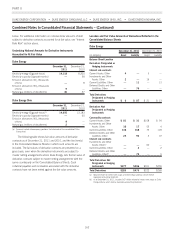
Location and Fair Value Amounts of Derivatives Reflected in the
Consolidated Balance Sheets
Duke Energy
December 31, 2011 December 31, 2010
(in millions) Asset Liability Asset Liability
Balance Sheet Location
Derivatives Designated as
Hedging Instruments
Interest rate contracts
Current Assets: Other 4—5—
Investments and Other
Assets: Other 2—16 —
Current Liabilities: Other —11—13
Deferred Credits and Other
Liabilities: Other —76——
Total Derivatives
Designated as Hedging
Instruments $ 6 $ 87 $21 $13
Derivatives Not
Designated as Hedging
Instruments
Commodity contracts
Current Assets: Other $81 $31 $108 $ 54
Investments and Other
Assets: Other 35 17 55 4
Current Liabilities: Other 136 168 75 118
Deferred Credits and Other
Liabilities: Other 25 93 372
Interest rate contracts
Investments and Other
Assets: Other(a) ——60 —
Current Liabilities: Other —2—2
Deferred Credits and Other
Liabilities: Other(b) —75—5
Total Derivatives Not
Designated as Hedging
Instruments $277 $386 $301 $255
Total Derivatives $283 $473 $322 $268
(a) Balance relates to interest rate swaps at Duke Energy Carolinas which receive
regulatory accounting treatment.
(b) As of December 31, 2011, includes $67 million related to interest rate swaps at Duke
Energy Indiana which receive regulatory accounting treatment.
162