Duke Energy 2011 Annual Report Download - page 68
Download and view the complete annual report
Please find page 68 of the 2011 Duke Energy annual report below. You can navigate through the pages in the report by either clicking on the pages listed below, or by using the keyword search tool below to find specific information within the annual report.-
 1
1 -
2
-
3
-
4
-
5
-
6
-
7
-
8
-
9
-
10
-
11
-
12
-
13
-
14
-
15
-
16
-
17
-
18
-
19
-
20
-
21
-
22
-
23
-
24
-
25
-
26
-
27
-
28
-
29
-
30
-
31
-
32
-
33
-
34
-
35
-
36
-
37
-
38
-
39
-
40
-
41
-
42
-
43
-
44
-
45
-
46
-
47
-
48
-
49
-
50
-
51
-
52
-
53
-
54
-
55
-
56
-
57
-
 58
58 -
 59
59 -
 60
60 -
 61
61 -
 62
62 -
 63
63 -
 64
64 -
 65
65 -
 66
66 -
 67
67 -
 68
68 -
 69
69 -
 70
70 -
 71
71 -
 72
72 -
 73
73 -
 74
74 -
 75
75 -
 76
76 -
 77
77 -
 78
78 -
79
-
80
-
81
-
82
-
83
-
84
-
85
-
86
-
87
-
88
-
89
-
90
-
91
-
92
-
93
-
94
-
95
-
96
-
97
-
98
-
99
-
100
-
101
-
102
-
103
-
104
-
105
-
106
-
107
-
108
-
109
-
110
-
111
-
112
-
113
-
114
-
115
-
116
-
117
-
118
-
119
-
120
-
121
-
122
-
123
-
124
-
125
-
126
-
127
-
128
-
129
-
130
-
131
-
132
-
133
-
134
-
135
-
136
-
137
-
138
-
139
-
140
-
141
-
142
-
143
-
144
-
145
-
146
-
147
-
148
-
149
-
150
-
151
-
152
-
153
-
154
-
155
-
156
-
157
-
158
-
159
-
160
-
161
-
162
-
163
-
164
-
165
-
166
-
167
-
168
-
169
-
170
-
171
-
172
-
173
-
174
-
175
-
176
-
177
-
178
-
179
-
180
-
181
-
182
-
183
-
184
-
185
-
186
-
187
-
188
-
189
-
190
-
191
-
192
-
193
-
194
-
195
-
196
-
197
-
198
-
199
-
200
-
201
-
202
-
203
-
204
-
205
-
206
-
207
-
208
-
209
-
210
-
211
-
212
-
213
-
214
-
215
-
216
-
217
-
218
-
219
-
220
-
221
-
222
-
223
-
224
-
225
-
226
-
227
-
228
-
229
-
230
-
231
-
232
-
233
-
234
-
235
-
236
-
237
-
238
-
239
-
240
-
241
-
242
-
243
-
244
-
245
-
246
-
247
-
248
-
249
-
250
-
251
-
252
-
253
-
254
-
255
-
256
-
257
-
258
-
259
-
260
-
261
-
262
-
263
-
264
-
265
-
266
-
267
-
268
-
269
-
270
-
271
-
272
-
273
-
274
-
275
 |
 |

PART II
Partially offsetting these increases was:
• A $67 million decrease in retail electric revenues resulting
from lower sales volumes driven by increased customer
switching levels net of weather and higher retail pricing under
the ESP in 2010.
Operating Expenses.
The increase was primarily driven by:
• A $259 million increase in impairment charges consisting of
$672 million in 2010 compared to $413 million in 2009
related primarily to goodwill and generation assets associated
with non-regulated generation operations in the Midwest. See
Note 12 to the Consolidated Financial Statements, “Goodwill,
Intangible Assets and Impairments,” for additional information;
• A $277 million increase in wholesale fuel expenses due to
higher generation volumes and less favorable hedge
realizations in 2010 as compared to 2009;
• A $32 million increase in depreciation and administrative
expenses associated with wind projects placed in service and
the continued development of the renewable business in
2010; and
• A $70 million increase in operating expenses resulting from
the amortization of certain deferred plant maintenance
expenses and higher transmission costs in 2010 compared to
2009 net of lower administrative expenses;
Partially offsetting these increases was:
• An $85 million decrease in mark-to-market fuel expense on
non-qualifying fuel hedge contracts, consisting of
mark-to-market gains of $27 million in 2010 compared to
losses of $58 million in 2009; and
• A $14 million decrease in retail fuel and purchased power
expenses due to lower generation volumes net of higher
purchased power volumes in 2010 as compared to 2009.
Gains on Sales of Other Assets and Other, net.
The decrease in 2010 as compared to 2009 is attributable to
lower gains on sales of emission allowances in 2010.
EBIT.
The decrease is primarily attributable to higher impairment
charges in 2010 associated with goodwill and generation assets of
the non-regulated generation operations in the Midwest, higher
operating expenses resulting from the amortization of certain deferred
plant maintenance expenses and higher transmission costs, and
lower retail revenues driven by customer switching. These factors
were partially offset by higher retail revenue pricing as a result of the
ESP, higher wholesale margins due to increased generation volumes
and PJM capacity revenues and mark-to-market gains on
non-qualifying fuel and power hedge contracts in 2010 compared to
losses in 2009.
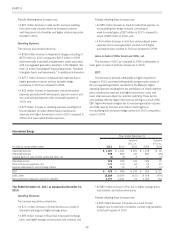
International Energy
Years Ended December 31,
(in millions, except where noted) 2011 2010
Variance
2011 vs.
2010 2009
Variance
2010 vs.
2009
Operating revenues $1,467 $ 1,204 $ 263 $ 1,158 $ 46
Operating expenses 938 806 132 834 (28)
(Losses) gains on sales of other assets and other, net (1) (3) 2 — (3)
Operating income 528 395 133 324 71
Other income and expenses, net 174 110 64 63 47
Expense attributable to noncontrolling interest 23 19 4 22 (3)
EBIT $679$ 486 $ 193 $ 365 $ 121
Sales, GWh 18,889 19,504 (615) 19,978 (474)
Net proportional megawatt capacity in operation 4,277 4,203 74 4,053 150
Year Ended December 31, 2011 as Compared to December 31,
2010
Operating Revenues.
The increase was driven primarily by:
• A $111 million increase in Central America as a result of
favorable hydrology and higher average prices;
• A $95 million increase in Brazil due to favorable exchange
rates, and higher average contract prices and volumes; and
• An $80 million increase in Peru due to higher average prices
and volumes, and hydrocarbon prices.
Partially offsetting these increases was:
• A $25 million decrease in Ecuador as a result of lower
dispatch due to new hydro competitor commencing operations
in the fourth quarter of 2010.
48