Duke Energy 2011 Annual Report Download - page 61
Download and view the complete annual report
Please find page 61 of the 2011 Duke Energy annual report below. You can navigate through the pages in the report by either clicking on the pages listed below, or by using the keyword search tool below to find specific information within the annual report.-
 1
1 -
2
-
3
-
4
-
5
-
6
-
7
-
8
-
9
-
10
-
11
-
12
-
13
-
14
-
15
-
16
-
17
-
18
-
19
-
20
-
21
-
22
-
23
-
24
-
25
-
26
-
27
-
28
-
29
-
30
-
31
-
32
-
33
-
34
-
35
-
36
-
37
-
38
-
39
-
40
-
41
-
42
-
43
-
44
-
45
-
46
-
47
-
48
-
49
-
50
-
 51
51 -
 52
52 -
 53
53 -
 54
54 -
 55
55 -
 56
56 -
 57
57 -
 58
58 -
 59
59 -
 60
60 -
 61
61 -
 62
62 -
 63
63 -
 64
64 -
 65
65 -
 66
66 -
 67
67 -
 68
68 -
 69
69 -
 70
70 -
 71
71 -
72
-
73
-
74
-
75
-
76
-
77
-
78
-
79
-
80
-
81
-
82
-
83
-
84
-
85
-
86
-
87
-
88
-
89
-
90
-
91
-
92
-
93
-
94
-
95
-
96
-
97
-
98
-
99
-
100
-
101
-
102
-
103
-
104
-
105
-
106
-
107
-
108
-
109
-
110
-
111
-
112
-
113
-
114
-
115
-
116
-
117
-
118
-
119
-
120
-
121
-
122
-
123
-
124
-
125
-
126
-
127
-
128
-
129
-
130
-
131
-
132
-
133
-
134
-
135
-
136
-
137
-
138
-
139
-
140
-
141
-
142
-
143
-
144
-
145
-
146
-
147
-
148
-
149
-
150
-
151
-
152
-
153
-
154
-
155
-
156
-
157
-
158
-
159
-
160
-
161
-
162
-
163
-
164
-
165
-
166
-
167
-
168
-
169
-
170
-
171
-
172
-
173
-
174
-
175
-
176
-
177
-
178
-
179
-
180
-
181
-
182
-
183
-
184
-
185
-
186
-
187
-
188
-
189
-
190
-
191
-
192
-
193
-
194
-
195
-
196
-
197
-
198
-
199
-
200
-
201
-
202
-
203
-
204
-
205
-
206
-
207
-
208
-
209
-
210
-
211
-
212
-
213
-
214
-
215
-
216
-
217
-
218
-
219
-
220
-
221
-
222
-
223
-
224
-
225
-
226
-
227
-
228
-
229
-
230
-
231
-
232
-
233
-
234
-
235
-
236
-
237
-
238
-
239
-
240
-
241
-
242
-
243
-
244
-
245
-
246
-
247
-
248
-
249
-
250
-
251
-
252
-
253
-
254
-
255
-
256
-
257
-
258
-
259
-
260
-
261
-
262
-
263
-
264
-
265
-
266
-
267
-
268
-
269
-
270
-
271
-
272
-
273
-
274
-
275
 |
 |

PART II
For the year ended December 31, 2011, Adjusted Earnings
was $1,943 million, or $1.46 per share, compared to Adjusted
Earnings of $1,882 million or $1.43 per share, for the same period
in 2010. The increase as compared to the prior year was primarily
due to:
• Increased earning associated with major construction projects
at USFE&G;
• Effect of prior year Duke Energy Foundation funding;
• Increased results in Brazil due to higher average contract
prices;
• Increased earnings from National Methanol Company (NMC);
• Lower corporate governance costs;
• Increased results in Peru due to additional capacity revenues
and an arbitration award; and
• Increased results in Central America due to higher average
prices and volumes.
Partially offset by
• Less favorable weather in 2011 compared to 2010 at
USFE&G;
• Increased operation and maintenance costs at USFE&G; and
• Lower volumes as a result of customer switching in Ohio, net
of retention by Duke Energy Retail Sales, LLC (Duke Energy
Retail) at Commercial Power.
For the year ended December 31, 2010, Adjusted Earnings
was $1,882 million, or $1.43 per share, compared to Adjusted
Earnings of $1,577 million or $1.22 per share, for the same period
in 2009. The increase as compared to the prior year was primarily
due to:
• Favorable weather at USFE&G;
• Increased earnings associated with major construction projects
at USF&G;
• Increased earnings due to 2009 North Carolina and South
Carolina rate cases at USFE&G; and
• Increased results from the Midwest gas assets due to both
volumes and price.
Partially offset by
• Increased operation and maintenance costs at USFE&G;
• Lower volumes as a result of customer switching in Ohio, net
of retention by Duke Energy Retail at Commercial Power; and
• Lower gains on coal and emission allowance sales at
Commercial Power.
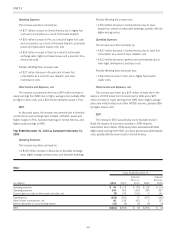
The following table contains summarized information from Duke Energy’s Consolidated Statements of Operations.
Years ended December 31,
(in millions) 2011 2010
Variance
2011 vs.
2010 2009
Variance
2010 vs.
2009
Operating revenues $14,529 $14,272 $ 257 $12,731 $1,541
Operating expenses 11,760 11,964 (204) 10,518 1,446
Gains on sales of other assets and other, net 8153 (145) 36 117
Operating income 2,777 2,461 316 2,249 212
Other income and expenses, net 547 589 (42) 333 256
Interest expense 859 840 19 751 89
Income from continuing operations before income taxes 2,465 2,210 255 1,831 379
Income tax expense from continuing operations 752 890 (138) 758 132
Income from continuing operations 1,713 1,320 393 1,073 247
Income from discontinued operations, net of tax 13(2)12(9)
Net income 1,714 1,323 391 1,085 238
Less: Net income attributable to noncontrolling interests 83510(7)
Net income attributable to Duke Energy Corporation $ 1,706 $ 1,320 $ 386 $ 1,075 $ 245
Consolidated Operating Revenues
Year Ended December 31, 2011 as Compared to
December 31, 2010. Consolidated operating revenues for 2011
increased $257 million compared to 2010. This change was
primarily driven by the following:
• A $263 million increase at International Energy. See
Operating Revenue discussion within “Segment Results” for
International Energy below for further information;
• A $43 million increase at Commercial Power. See Operating
Revenue discussion within “Segment Results” for Commercial
Power below for further information; and
• A $22 million increase at USFE&G. See Operating Revenue
discussion within “Segment Results” for USFE&G below for
further information.
41