Duke Energy 2011 Annual Report Download - page 171
Download and view the complete annual report
Please find page 171 of the 2011 Duke Energy annual report below. You can navigate through the pages in the report by either clicking on the pages listed below, or by using the keyword search tool below to find specific information within the annual report.-
 1
1 -
2
-
3
-
4
-
5
-
6
-
7
-
8
-
9
-
10
-
11
-
12
-
13
-
14
-
15
-
16
-
17
-
18
-
19
-
20
-
21
-
22
-
23
-
24
-
25
-
26
-
27
-
28
-
29
-
30
-
31
-
32
-
33
-
34
-
35
-
36
-
37
-
38
-
39
-
40
-
41
-
42
-
43
-
44
-
45
-
46
-
47
-
48
-
49
-
50
-
51
-
52
-
53
-
54
-
55
-
56
-
57
-
58
-
59
-
60
-
61
-
62
-
63
-
64
-
65
-
66
-
67
-
68
-
69
-
70
-
71
-
72
-
73
-
74
-
75
-
76
-
77
-
78
-
79
-
80
-
81
-
82
-
83
-
84
-
85
-
86
-
87
-
88
-
89
-
90
-
91
-
92
-
93
-
94
-
95
-
96
-
97
-
98
-
99
-
100
-
101
-
102
-
103
-
104
-
105
-
106
-
107
-
108
-
109
-
110
-
111
-
112
-
113
-
114
-
115
-
116
-
117
-
118
-
119
-
120
-
121
-
122
-
123
-
124
-
125
-
126
-
127
-
128
-
129
-
130
-
131
-
132
-
133
-
134
-
135
-
136
-
137
-
138
-
139
-
140
-
141
-
142
-
143
-
144
-
145
-
146
-
147
-
148
-
149
-
150
-
151
-
152
-
153
-
154
-
155
-
156
-
157
-
158
-
159
-
160
-
 161
161 -
 162
162 -
 163
163 -
 164
164 -
 165
165 -
 166
166 -
 167
167 -
 168
168 -
 169
169 -
 170
170 -
 171
171 -
 172
172 -
 173
173 -
 174
174 -
 175
175 -
 176
176 -
 177
177 -
 178
178 -
 179
179 -
 180
180 -
 181
181 -
182
-
183
-
184
-
185
-
186
-
187
-
188
-
189
-
190
-
191
-
192
-
193
-
194
-
195
-
196
-
197
-
198
-
199
-
200
-
201
-
202
-
203
-
204
-
205
-
206
-
207
-
208
-
209
-
210
-
211
-
212
-
213
-
214
-
215
-
216
-
217
-
218
-
219
-
220
-
221
-
222
-
223
-
224
-
225
-
226
-
227
-
228
-
229
-
230
-
231
-
232
-
233
-
234
-
235
-
236
-
237
-
238
-
239
-
240
-
241
-
242
-
243
-
244
-
245
-
246
-
247
-
248
-
249
-
250
-
251
-
252
-
253
-
254
-
255
-
256
-
257
-
258
-
259
-
260
-
261
-
262
-
263
-
264
-
265
-
266
-
267
-
268
-
269
-
270
-
271
-
272
-
273
-
274
-
275
 |
 |

PART II
DUKE ENERGY CORPORATION •DUKE ENERGY CAROLINAS, LLC •DUKE ENERGY OHIO, INC. •DUKE ENERGY INDIANA, INC.
Combined Notes to Consolidated Financial Statements – (Continued)
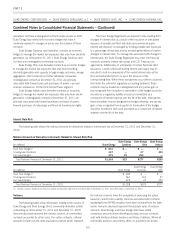
(in millions) USFE&G
Commercial
Power Total
Duke Energy Ohio
Balance at December 31, 2010:
Goodwill $1,137 $ 1,188 $ 2,325
Accumulated Impairment Charges (216) (1,188) (1,404)
Balance at December 31, 2010, as
adjusted for accumulated impairment
charges 921 — 921
Balance as of December 31, 2011:
Goodwill 1,137 1,188 2,325
Accumulated Impairment Charges (216) (1,188) (1,404)
Balance at December 31, 2011, as
adjusted for accumulated impairment
charges $ 921 $ — $ 921
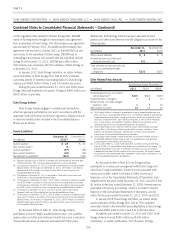
Duke Energy.
Duke Energy is required to perform an annual goodwill
impairment test as of the same date each year and, accordingly,
performs its annual impairment testing of goodwill as of August 31.
Duke Energy updates the test between annual tests if events or
circumstances occur that would more likely than not reduce the fair
value of a reporting unit below its carrying value.
Duke Energy early adopted the revised goodwill impairment
accounting guidance during the third quarter of 2011 and applied
this revised guidance to its August 31, 2011 annual goodwill
impairment test. Pursuant to the revised guidance an entity may first
assess qualitative factors to determine whether it is necessary to
perform the two step goodwill impairment test. If deemed necessary,
the two-step impairment test shall be used to identify potential
goodwill impairment and measure the amount of a goodwill
impairment loss, if any, to be recognized. Duke Energy’s annual
qualitative assessments under the new accounting guidance include
reviews of current forecasts compared to prior forecasts, consideration
of recent fair value calculations, if any, review of Duke Energy’s, as
well as its peers, stock price performance, credit ratings of Duke
Energy’s significant subsidiaries, updates to weighted average cost of
capital (WACC) calculations or review of the key inputs to the WACC
and consideration of overall economic factors, recent regulatory
commission actions and related regulatory climates, and recent
financial performance. Duke Energy determined it was more likely
than not that the fair value of each of its reporting units exceeded
their carrying value at August 31, 2011 and that the two step
goodwill impairment test was not required.
In the second quarter of 2010, based on circumstances
discussed below, management determined that it was more likely
than not that the fair value of Commercial Power’s non-regulated
Midwest generation reporting unit was below its respective carrying
value. Accordingly, an interim impairment test was performed for this
reporting unit. Determination of reporting unit fair value was based on
a combination of the income approach, which estimates the fair
value of Duke Energy’s reporting units based on discounted future
cash flows, and the market approach, which estimates the fair value
of Duke Energy’s reporting units based on market comparables within
the utility and energy industries. Based on completion of step one of
the second quarter 2010 impairment analysis, management
determined that the fair value of Commercial Power’s non-regulated
Midwest generation reporting unit was less than its carrying value,
which included goodwill of $500 million.
Commercial Power’s non-regulated Midwest generation
reporting unit includes nearly 4,000 MW of primarily coal-fired
generation capacity in Ohio which was dedicated under the ESP
through December 31, 2011. Additionally, this reporting unit has
approximately 3,600 MW of gas-fired generation capacity in Ohio,
Pennsylvania, Illinois and Indiana which provides generation to
unregulated energy markets in the Midwest. The businesses within
Commercial Power’s non-regulated Midwest generation reporting unit
operate in unregulated markets which allow for customer choice
among suppliers. As a result, the operations within this reporting unit
are subjected to competitive pressures that do not exist in any of
Duke Energy’s regulated jurisdictions.
Commercial Power’s other businesses, including the renewable
generation assets, are in a separate reporting unit for goodwill
impairment testing purposes. No impairment existed with respect to
Commercial Power’s renewable generation assets.
The fair value of Commercial Power’s non-regulated Midwest
generation reporting unit is impacted by a multitude of factors,
including current and forecasted customer demand, forecasted power
and commodity prices, uncertainty of environmental costs,
competition, the cost of capital, valuation of peer companies and
regulatory and legislative developments. Management’s assumptions
and views of these factors continually evolve, and certain views and
assumptions used in determining the fair value of the reporting unit in
the 2010 interim impairment test changed significantly from those
used in the 2009 annual impairment test. These factors had a
significant impact on the valuation of Commercial Power’s
non-regulated Midwest generation reporting unit. More specifically,
the following factors significantly impacted management’s valuation
of the reporting unit:
•Sustained lower forward power prices —InOhio,Duke
Energy’s Commercial Power segment provided power to retail
customers under the ESP, which utilizes rates approved by the
PUCO through 2011. These rates in 2010 were above market
prices for generation services, resulting in customers switching
to other generation providers. As discussed in Note 4, Duke
Energy Ohio will establish a new SSO for retail load customers
for generation after the current ESP expires on December 31,
2011. Given forward power prices, which declined from the
time of the 2009 impairment, significant uncertainty existed
with respect to the generation margin that would be earned
under the new SSO.
•Potentially more stringent environmental regulations from the
U.S. EPA—In May and July of 2010, the EPA issued
151