Duke Energy 2011 Annual Report Download - page 202
Download and view the complete annual report
Please find page 202 of the 2011 Duke Energy annual report below. You can navigate through the pages in the report by either clicking on the pages listed below, or by using the keyword search tool below to find specific information within the annual report.-
 1
1 -
2
-
3
-
4
-
5
-
6
-
7
-
8
-
9
-
10
-
11
-
12
-
13
-
14
-
15
-
16
-
17
-
18
-
19
-
20
-
21
-
22
-
23
-
24
-
25
-
26
-
27
-
28
-
29
-
30
-
31
-
32
-
33
-
34
-
35
-
36
-
37
-
38
-
39
-
40
-
41
-
42
-
43
-
44
-
45
-
46
-
47
-
48
-
49
-
50
-
51
-
52
-
53
-
54
-
55
-
56
-
57
-
58
-
59
-
60
-
61
-
62
-
63
-
64
-
65
-
66
-
67
-
68
-
69
-
70
-
71
-
72
-
73
-
74
-
75
-
76
-
77
-
78
-
79
-
80
-
81
-
82
-
83
-
84
-
85
-
86
-
87
-
88
-
89
-
90
-
91
-
92
-
93
-
94
-
95
-
96
-
97
-
98
-
99
-
100
-
101
-
102
-
103
-
104
-
105
-
106
-
107
-
108
-
109
-
110
-
111
-
112
-
113
-
114
-
115
-
116
-
117
-
118
-
119
-
120
-
121
-
122
-
123
-
124
-
125
-
126
-
127
-
128
-
129
-
130
-
131
-
132
-
133
-
134
-
135
-
136
-
137
-
138
-
139
-
140
-
141
-
142
-
143
-
144
-
145
-
146
-
147
-
148
-
149
-
150
-
151
-
152
-
153
-
154
-
155
-
156
-
157
-
158
-
159
-
160
-
161
-
162
-
163
-
164
-
165
-
166
-
167
-
168
-
169
-
170
-
171
-
172
-
173
-
174
-
175
-
176
-
177
-
178
-
179
-
180
-
181
-
182
-
183
-
184
-
185
-
186
-
187
-
188
-
189
-
190
-
191
-
 192
192 -
 193
193 -
 194
194 -
 195
195 -
 196
196 -
 197
197 -
 198
198 -
 199
199 -
 200
200 -
 201
201 -
 202
202 -
 203
203 -
 204
204 -
 205
205 -
 206
206 -
 207
207 -
 208
208 -
 209
209 -
 210
210 -
 211
211 -
 212
212 -
213
-
214
-
215
-
216
-
217
-
218
-
219
-
220
-
221
-
222
-
223
-
224
-
225
-
226
-
227
-
228
-
229
-
230
-
231
-
232
-
233
-
234
-
235
-
236
-
237
-
238
-
239
-
240
-
241
-
242
-
243
-
244
-
245
-
246
-
247
-
248
-
249
-
250
-
251
-
252
-
253
-
254
-
255
-
256
-
257
-
258
-
259
-
260
-
261
-
262
-
263
-
264
-
265
-
266
-
267
-
268
-
269
-
270
-
271
-
272
-
273
-
274
-
275
 |
 |

PART II
DUKE ENERGY CORPORATION •DUKE ENERGY CAROLINAS, LLC •DUKE ENERGY OHIO, INC. •DUKE ENERGY INDIANA, INC.
Combined Notes to Consolidated Financial Statements – (Continued)
The carrying values of the retained interests are determined by
allocating the carrying value of the receivables between the assets
sold and the interests retained based on relative fair value. Because
the receivables generally turnover in less than two months, credit
losses are reasonably predictable due to the broad customer base and
lack of significant concentration, and the purchased beneficial interest
(equity in CRC) is subordinate to all retained interests and thus would
absorb losses first, the allocated basis of the subordinated notes are
not materially different than their face value. The hypothetical effect
on the fair value of the retained interests assuming both a 10% and a
20% unfavorable variation in credit losses or discount rates is not
material due to the short turnover of receivables and historically low
credit loss history. Interest accrues to Duke Energy Ohio, Duke Energy
Indiana and Duke Energy Kentucky on the retained interests using
the accretable yield method, which generally approximates the stated
rate on the notes since the allocated basis and the face value are
nearly equivalent. An impairment charge is recorded against the
carrying value of both the retained interests and purchased beneficial
interest whenever it is determined that an other-than-temporary
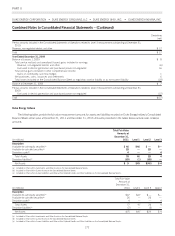
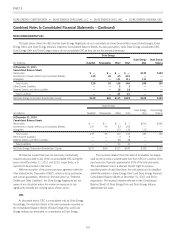
impairment has occurred. The key assumptions used in estimating
the fair value in 2011 and 2010 is detailed in the following table:
2011 2010
Duke Energy Ohio
Anticipated credit loss ratio 0.8% 0.8%
Discount rate 2.6% 2.7%
Receivable turnover rate 12.7% 12.6%
Duke Energy Indiana
Anticipated credit loss ratio 0.4% 0.5%
Discount rate 2.6% 2.7%
Receivable turnover rate 10.2% 10.2%
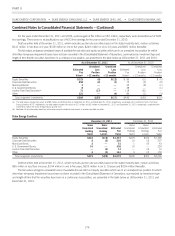
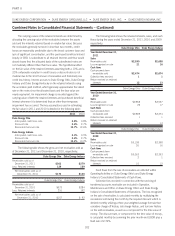
The following table shows the gross and net receivables sold as
of December 31, 2011 and December 31, 2010, respectively:
Duke Energy Ohio Duke Energy Indiana
Receivables sold as of
December 31, 2011 $302 $279
Less: Retained interests 129 139
Net receivables sold as of
December 31, 2011 $173 $140
Duke Energy Ohio Duke Energy Indiana
Receivables sold as of
December 31, 2010 $373 $284
Less: Retained interests 216 192
Net receivables sold as of
December 31, 2010 $157 $ 92
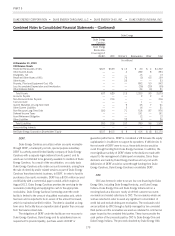
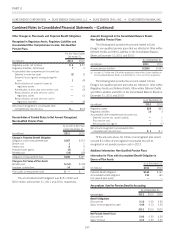
The following table shows the retained interests, sales, and cash
flows during the years ended December 31, 2011, 2010 and 2009
respectively:
Duke Energy Ohio Duke Energy Indiana
Year Ended December 31,
2011
Sales
Receivables sold $2,390 $2,658
Loss recognized on sale 21 16
Cash flows
Cash proceeds from
receivables sold $2,474 $2,674
Collection fees received 11
Return received on retained
interests 12 13
Duke Energy Ohio Duke Energy Indiana
Year Ended December 31,
2010
Sales
Receivables sold $2,858 $2,537
Loss recognized on sale 26 17
Cash flows
Cash proceeds from
receivables sold $2,809 $2,474
Collection fees received 1 1
Return received on retained
interests 15 13
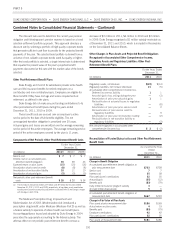
Duke Energy Ohio Duke Energy Indiana
Year Ended December 31,
2009
Sales
Receivables sold $3,108 $2,398
Loss recognized on sale 26 16
Cash flows
Cash proceeds from
receivables sold $3,063 $2,353
Collection fees received 2 1
Return received on retained
interests 15 12
Cash flows from the sale of receivables are reflected within
Operating Activities on Duke Energy Ohio’s and Duke Energy
Indiana’s Consolidated Statements of Cash Flows.
Collection fees received in connection with the servicing of
transferred accounts receivable are included in Operation,
Maintenance and Other on Duke Energy Ohio’s and Duke Energy
Indiana’s Consolidated Statements of Operations. The loss recognized
on the sale of receivables is calculated monthly by multiplying the
receivables sold during the month by the required discount which is
derived monthly utilizing a three year weighted average formula that
considers charge-off history, late charge history, and turnover history
on the sold receivables, as well as a component for the time value of
money. The discount rate, or component for the time value of money,
is calculated monthly by summing the prior month-end LIBOR plus a
fixed rate of 2.39%.
182